Although most health care in Canada is paid for publicly, private health insurance plays a major supporting role, particularly for prescription drugs, dental services and eye care.1 Expenditures from private insurers totalled $22.7 billion in 2010, accounting for 11.7% of health care spending.1 At this level, Canada ranks second among nations in the Organisation for Economic Co-operation and Development in terms of per capita private health insurance expenditures.2 About 60% of Canadians are covered by private health insurance, most often as a benefit of employment.3 For-profit firms dominate the private health insurance landscape in Canada, representing about 80% of the market.4 Despite its widespread use and importance in Canadian health care, there has been limited assessment of the performance of private health insurance. We examined the efficiency of Canadian private health insurers by comparing the premiums they collected with the benefits they paid for over time.
Efficiency and the “right” level of administrative costs
When considering the performance of private health insurance, it is important to examine the relative value for money that Canadians obtain through private health insurance versus public alternatives. From the standpoint of productive efficiency, the optimal financing mechanism is the one that maximizes health outcomes within a given budget.5 Private insurance plans and their public alternatives may differ in the amount of health-improving services (e.g., the quantity of prescription drugs) delivered for a given expenditure level in three ways:1 the administrative costs incurred in providing the coverage, including costs such as wages and marketing;2 the prices paid for the actual health services purchased;3 and profits, which of course apply only to for-profit private insurers.6
Profits and administration expenses of private health insurance firms have generated substantial debate and policy change in other countries, particularly the United States.7 For example, after the US Medicare program started allowing members to use private insurers, administrative spending grew substantially.7 Similarly, prior estimates have suggested that 39% of the difference in physician and hospital expenditures between Canada and the US results from differences in administrative expenses borne by both insurers and providers.6
Concern over such spending has led to major policy changes in the US. For example, although the most prominent objective of the Patient Protection and Affordable Care Act of 2010 is to increase health insurance coverage, another provision requires insurers to spend the vast majority of premium revenue on medical care: the proportion of premium income that must be spent on clinical care and quality improvement initiatives is 80% for small-group plans and 85% for large-group plans.8 If a greater share of premium revenue goes toward administration and profits, the excess must be rebated to plan members. As a result, $1.1 billion was paid out by US health insurance plans as rebates in 2012, and early evidence indicates that the imposition of these limits resulted in lower administrative spending.8
Canada has no such requirements for all private insurers. However, the available data clearly indicate that the administrative expenses of private health insurance firms in Canada are higher than those in the public sector. For example, estimates suggest that private insurers in Canada have overhead expenses 10 times higher than in the public system.9 Such figures also omit the administrative cost to providers, such as pharmacies and dental offices, of having to interact with multiple insurers.7
Trends in administrative expenses and profit
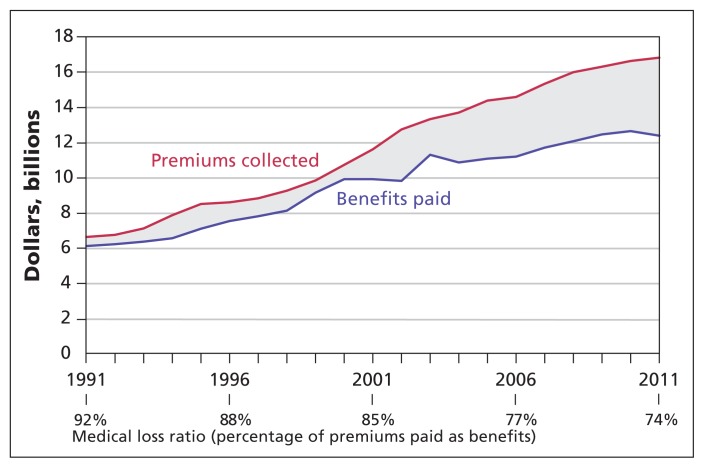
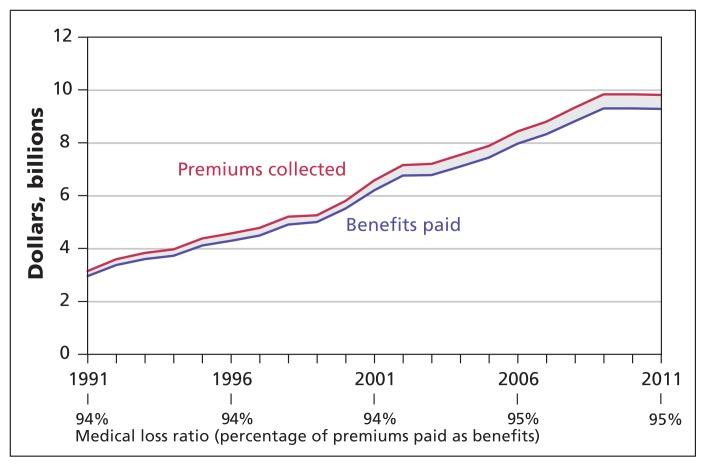
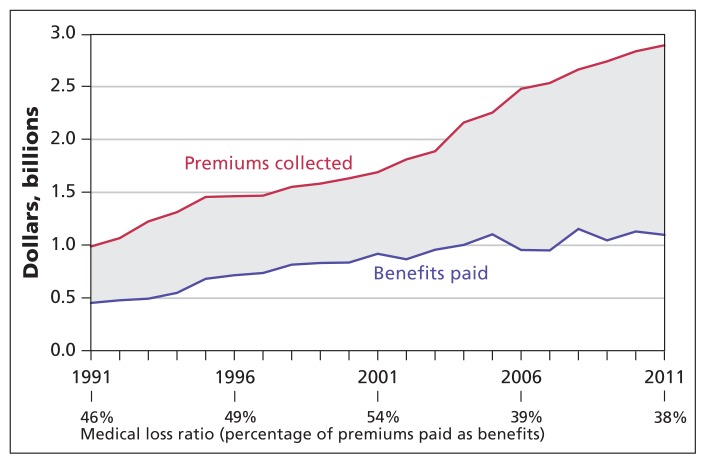
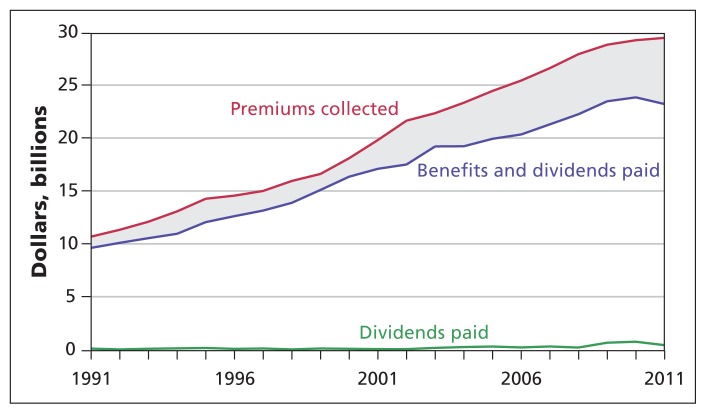
Along with estimates suggesting that the administrative expenses of private insurers in Canada are higher than those in the public sector, industry data also show that these amounts have increased over the past two decades. We compiled and adjusted for inflation the premium income collected and benefits paid for services that plan members received from for-profit health insurers from 1991 through 2011, using data from reports published by the Canadian Life and Health Insurance Association.10,11 The proportion of premium income spent on benefits is referred to as the “medical loss ratio.” The remainder consists of the amount spent on administration, the amount kept as profit and any other nonmedical spending (elements that are not separately reported by the Canadian Life and Health Insurance Association). Figures 1 to 3 show these numbers for the three major types of for-profit private health benefits plans in Canada: insured group plans (i.e., small and medium-sized employers; Figure 1), plans purchased by individuals (Figure 2) and self-insured group plans (i.e., those where large employers pay claims themselves, purchasing only processing services from the insurance company; Figure 3). Figure 4 shows the same data for all plan types combined, along with policy dividends paid to some policyholders. Of note, these dividends never exceeded 3% of total premiums collected in any given year.
Figure 1:
Premium income, benefits paid and medical loss ratio for insured group plans by for-profit Canadian health benefits plan providers from 1991 to 2011 (adjusted to 2011 dollars using the consumer price index11). Data source: Canadian Life and Health Insurance Association Life and Health Insurance Facts (1992–2012 editions).10
Figure 3:
Premium income, benefits paid and medical loss ratio for self-insured group plans by for-profit Canadian health benefits plan providers from 1991 to 2011 (adjusted to 2011 dollars using the consumer price index11). Data source: Canadian Life and Health Insurance Association Life and Health Insurance Facts (1992–2012 editions).10
Figure 2:
Premium income, benefits paid and medical loss ratio for individual plans by for-profit Canadian health benefits plan providers from 1991 to 2011 (adjusted to 2011 dollars using the consumer price index11). Data source: Canadian Life and Health Insurance Association Life and Health Insurance Facts (1992–2012 editions).10
Figure 4:
Premium income, benefits and dividends paid, and dividend payments for all types of health insurance plans by for-profit Canadian health benefits plan providers from 1991 to 2011 (adjusted to 2011 dollars using the consumer price index11). Data source: Canadian Life and Health Insurance Association Life and Health Insurance Facts (1992–2012 editions).10
As shown in Figures 1 and 2, medical loss ratios have dropped substantially for both group plans and individual plans over the past 20 years. For group plans, the percentage of premium revenue paid out as benefits dropped from 92% of premiums in 1991 to 74% in 2011. The difference between premiums and benefits consequently tripled, reaching $4.4 billion in 2011. The Canadian Life and Health Insurance Association does not report dividend payments to policyholders by insurance type; however, even if one assumes that all policy dividends were paid out in the group insured market, the medical loss ratio was 77% in 2011 — notably lower than the 80% or 85% minimum now in place for private health insurance in the US. Premium revenue also increased much more rapidly than benefits paid in individual plans, with the medical loss ratio in these plans decreasing from 46% to 38% over the same period. Across all types of for-profit private insurance, industry data suggest that Canadians paid nearly $6.8 billion more in premiums than was paid out in benefits in 2011 (Figure 4).
From the standpoint of productive efficiency, there is little question that this growth in administration, profits and other nonhealth spending increased total expenditures: insured group plan expenditures were $3.2 billion higher in 2011 than they would have been had the medical loss ratio remained at 1991 levels.
The fundamentally important question is whether this additional expenditure produces better health outcomes for Canadians. To answer this question, it is important to determine why the percentage spent on benefits has dropped. We believe there are four potential explanations for this change among Canadian for-profit insurers:1 the cost of administering private health insurance plans increased,2 the plans engaged in management practices that decreased the cost of the actual services provided,3 insurance firms are increasing their reserve funds4 or private insurers have increased the mark-ups charged on health coverage plans.
Has the cost of administration changed?
The first plausible explanation is that the cost of delivering these plans has changed over the past 20 years. For evidence on this point, we turn to the administrative costs that insurers charge to large employers’ self-insured group plans. In these types of plans, insurers simply act as claims processors, and employers bear all the risk.
As shown in Figure 3, the medical loss ratios in the self-insured group have remained remarkably constant over this period, increasing from 94% to 95%. This small increase likely resulted from increases in technical efficiency driven by developments in information and communication technology, such as the use of pay-direct electronic drug cards. Although differences remain in the types of services that are covered by self-insured group plans and insured group plans, it appears very unlikely that such differences would explain the threefold increase in nonmedical spending for insured plans over this period.
Are private health insurance firms using innovative methods to reduce service costs?
A lower medical loss ratio might be considered justified if the added expenditure was supporting activities that lowered costs for the medical services delivered. If this were the case, the freed-up resources could be allocated to other health-improving activities. Given that prescription drugs are the key area where both public and private alternatives exist in Canada, they provide fertile ground for comparing the performance of private plans with their public counterparts. For example, more aggressive price negotiation with providers or the development and use of sophisticated formulary management for drug benefits might merit higher administrative charges.12
Here, however, the evidence suggests that private insurers have not made substantial changes and in fact continue to fall behind their public counterparts in terms of cost management.13 For example, many private health insurance plans do not use cost-saving activities common to every public sector plan, such as requiring generic substitution or capping dispensing fees.14 There is also evidence that private health insurance firms pay higher prices for the same medicines than public plans: an analysis by the Competition Bureau found that private health insurers pay 7% more for generic drugs and 10% more for brandname drugs.15
More recently, public insurance plans have likely increased this gap through the increasingly frequent use of product listing agreements.16 These agreements between public drug plans and drug manufacturers result in provinces listing drugs on their formularies in exchange for a substantial price discount relative to the list prices paid by private insurers. Some estimates indicate that these confidential negotiated discounts can be more than 40% of the listed price in other countries.17 The very limited use of managed formularies — a list of the drugs covered by the plan — in the past by private drug plans in Canada has made it difficult, if not impossible, for insurers to negotiate similar preferred discounts or rebates in exchange for preferential listing status.14 Industry estimates also suggest that the limited use of formularies resulted in private plans paying $3.9 billion more for drugs in 2012 where equally effective therapeutic alternatives were available.18
Are insurers setting aside more reserve funds?
A third possible explanation for the increasing gap between premiums and benefit payments is that insurers are setting aside reserve funds for the purpose of paying future claims. This would mainly apply to long-term disability coverage, given that the other major benefits, such as dental services and prescription drugs, generally only cover claims within the coverage period. The Canadian Life and Health Insurance Association reports indicate that the per-capita benefits paid per insured disability plan enrollee decreased substantially over the 15 years from 1996 to 2011.10,11 Therefore, it seems unlikely that the need to accumulate larger reserves for the purpose of paying future disability claims is a major factor in explaining the gap between premiums and payments for benefits. However, it is impossible to completely assess this theoretical possibility without greater public disclosure of industry data.
Have insurers increased their mark-ups?
A final plausible explanation for the relative decrease in benefits spending is that insurers have increased their mark-ups. This might have resulted from the changing incentives facing the large players in the Canadian health insurance industry. Until 1997, many large firms in Canada were mutual companies, meaning that insurance policyholders owned the companies. In the late 1990s, however, a substantial change in Canadian law allowed large insurers to convert from mutual companies owned by insurance policy-holders to for-profit companies publicly held by shareholders.4 This change dramatically altered the incentives facing firms: rather than being solely accountable to policyholder owners, these firms now had a dual accountability to provide services to policyholders, while also providing a return on investment to shareholders. This could have taken the form of higher dividend payments to shareholders or corporate growth through acquisitions. Notably, neither of these activities would have increased the health benefits delivered to plan members. As is apparent from Figures 1 and 2, the difference between premium income and benefit payments in insured plans appeared to grow more rapidly in the years following demutualization.
Limitations of the analysis
The main shortcoming in any examination of private insurance is the paucity of publicly available data regarding private health insurance premiums and benefits. We could not determine, for example, whether the decrease in the medical loss ratio was largely due to greater profits, higher wages, more expensive marketing or something else. Furthermore, we could not separate in our analysis services that many would consider as necessary components of health care (e.g., prescription drug coverage) from other services that might reasonably be considered more discretionary in nature (e.g., travel insurance). We also did not have data to compare the performance of nonprofit and for-profit firms.
Implications for the Canadian health care system
Unlike other countries that rely heavily on private insurance, Canada has comparatively light regulation of private health insurers.4 For example, there are no restrictions in Canada regarding the percentage of premium revenue that must be paid as benefits. Absent such oversight, nonmedical spending in insured group plans offered by for-profit firms has nearly tripled as a percentage of premium income. Furthermore, it appears from the available evidence that these increases are not related to changes in plan design that would benefit plan members. In the long term, increases in the cost of insurance, including both administrative spending and profits, are of course passed on to individual Canadians. Furthermore, such increases may result in lower wage growth or reduced health benefits coverage.
The available evidence suggests that Canadians are not getting as much as they could for each dollar spent on for-profit private health insurance. Governments could take one of two approaches to improving this situation: replace private insurance with more efficient public alternatives or impose new regulations on the private insurance sector. With respect to the first of these two options, there is considerable evidence in some spending areas, most notably for prescription drugs, that universal public coverage would save costs at a societal level.19 For the other spending areas, the second option, regulation, could come into play: provincial and territorial governments could require greater transparency about nonmedical spending from private insurance firms and could consider setting minimum regulatory limits for medical loss ratios. Such measures would likely result in better value for money in Canadian health care.
Key points
Private insurance companies play a substantial role in financing particular health care services in Canada, such as prescription drugs.
The percentage of private health insurance premiums paid out as benefits has decreased markedly over the past 20 years, leading to a gap between premiums collected and benefits paid of $6.8 billion in 2011.
Governments across Canada should regulate the private health insurance industry more effectively to provide greater transparency and better value for Canadians.
Footnotes
Competing interests: Michael Law has consulted for Health Canada on unrelated pharmaceutical policy research. Irfan Dhalla has received research funding from the Green Shield Foundation of Canada for work on unrelated research and is a volunteer member of the board of Canadian Doctors for Medicare. Jillian Kratzer reports no competing interests.
This article has been peer reviewed.
Contributors: Michael Law contributed to the conception and design of the study and the acquisition, analysis and interpretation of the data; he also drafted the manuscript. Jillian Kratzer contributed to the study design and to analysis and interpretation of the data, and revised the manuscript for important intellectual content. Irfan Dhalla contributed to the acquisition, analysis and interpretation of the data and revised the manuscript for important intellectual content. All authors approved the final version to be published and agree to be accountable for all aspects of the work, specifically in ensuring that questions related to the accuracy or integrity of any part of the work are appropriately investigated and resolved.
Funding: This research was funded by an operating grant from the Canadian Institutes of Health Research (“For Whom the Bill Tolls: Private Drug Insurance in Canada,” principal investigator Michael Law). Michael Law received salary support through a New Investigator Award from the Canadian Institutes of Health Research and a Scholar Award from the Michael Smith Foundation for Health Research. Irfan Dhalla also received salary support through a New Investigator Award from the Canadian Institutes of Health Research and an Early Researcher Award from the Government of Ontario.
References
- 1.National health expenditure trends, 1975 to 2012. Ottawa (ON): Canadian Institute for Health Information; 2012 [Google Scholar]
- 2.OECD. StatExtracts. Organisation for Economic Co-operation and Development; 2013. Available: http://stats.oecd.org//Index.aspx?QueryId=54875 (accessed 2013 June 11). [Google Scholar]
- 3.Allin S, Hurley J. Inequity in publicly funded physician care: What is the role of private prescription drug insurance? Health Econ 2009;18:1218–32 [DOI] [PubMed] [Google Scholar]
- 4.Hurley J, Guindon E. Private health insurance in Canada. CHEPA Work Pap 08-04. Hamilton (ON): McMaster University, Centre for Health Economics and Policy Analysis; 2008. Available: http://chepa.org/docs/working-papers/chepa-wp-08-04-.pdf (accessed 2010 Nov. 9). [Google Scholar]
- 5.Baicker K, Chandra A. Aspirin, angioplasty, and proton beam therapy: the economics of smarter health care spending. In: Proceedings of “Achieving maximum long-run growth”: Federal Reserve Bank of Kansas City economic policy symposium; 2011 Aug. 25–27; Jackson Hole (WY) Available: http://new.therpmreport.com/~/media/Images/Publications/Archive/The%20Gray%20Sheet/37/36/01110905004/090511_harvard_health_spending_report.pdf (accessed 2013 Apr. 24). [Google Scholar]
- 6.Cutler DM, Ly DP. The (paper) work of medicine: understanding international medical costs. J Econ Perspect 2011;25:3–25 [DOI] [PMC free article] [PubMed] [Google Scholar]
- 7.Sullivan K. How to think clearly about medicare administrative costs: data sources and measurement. J Health Polit Policy Law 2013;38:479–504 [DOI] [PubMed] [Google Scholar]
- 8.McCue MJ. Hall. Insurers’ responses to regulation of medical loss ratios. Washington (DC): The Commonwealth Fund; 2012. Available: www.commonwealthfund.org/~/media/Files/Publications/Issue%20Brief/2012/Dec/1634_McCue_insurers_responses_MLR_regulation_ib.pdf (accessed 2013 Jan. 25). [PubMed] [Google Scholar]
- 9.Woolhandler S, Campbell T, Himmelstein DU. Costs of health care administration in the United States and Canada. N Engl J Med 2003; 349:768–75 [DOI] [PubMed] [Google Scholar]
- 10.Canadian life and health insurance facts [annual]. Ottawa (ON): Canadian Life and Health Insurance Association; 1992–2012 [Google Scholar]
- 11.Consumer price index, 2000 to present. Ottawa (ON): Bank of Canada; 2012. Available: www.bankofcanada.ca/en/cpi.html (accessed 2013 Apr. 6). [Google Scholar]
- 12.Frakt A. JAMA forum: Are health insurers’ administrative costs too high or too low? In: news@JAMA. Chicago (IL): American Medical Association; 2013. April 24 Available: http://newsatjama.jama.com/2013/04/24/jama-forum-are-health-insurers-administrative-costs-too-high-or-too-low/ (accessed 2013 Apr. 24). [Google Scholar]
- 13.Stevenson H. An end to blank cheques: getting more value out of employer drug plans. Toronto (ON): Reformulary Group; 2011. Available: www.reformulary.com/files_docs/content/pdf/en/An_End_to_Blank_Cheques-May_2011_ENr.pdf (accessed 2013 June 4). [Google Scholar]
- 14.Kratzer J, McGrail K, Strumpf E, et al. Cost-control mechanisms in Canadian private drug plans. Healthc Policy 2013;9:35–43 [PMC free article] [PubMed] [Google Scholar]
- 15.Canadian generic drug sector study. Gatineau (QC): Competition Bureau; 2007. Available: www.bureaudelaconcurrence.gc.ca/eic/site/cb-bc.nsf/eng/02495.html (accessed 2012 Jul. 23). [Google Scholar]
- 16.Morgan S, Daw J, Thomson P. International best practices for negotiating “reimbursement contracts” with price rebates from pharmaceutical companies. Health Aff (Millwood) 2013;32:771–7 [DOI] [PubMed] [Google Scholar]
- 17.Morgan S, Hanley G, Mcmahon M, et al. Influencing drug prices through formulary-based policies: lessons from New Zealand. Healthc Policy 2007;3:e121–40 [PMC free article] [PubMed] [Google Scholar]
- 18.2012 drug trend report. Toronto (ON): Express Scripts Canada; 2013 [Google Scholar]
- 19.Morgan SG, Daw JR, Law MR. Rethinking pharmacare in Canada. Toronto (ON): CD Howe Institute; 2013 [Google Scholar]


