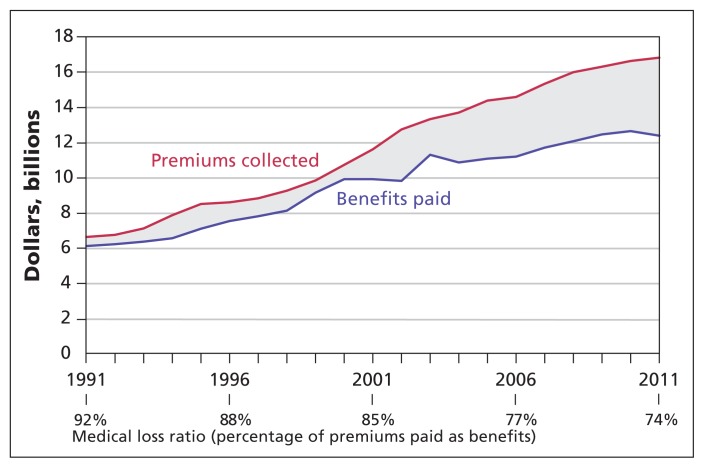
Figure 1:
Premium income, benefits paid and medical loss ratio for insured group plans by for-profit Canadian health benefits plan providers from 1991 to 2011 (adjusted to 2011 dollars using the consumer price index11). Data source: Canadian Life and Health Insurance Association Life and Health Insurance Facts (1992–2012 editions).10

