
Figure 6.
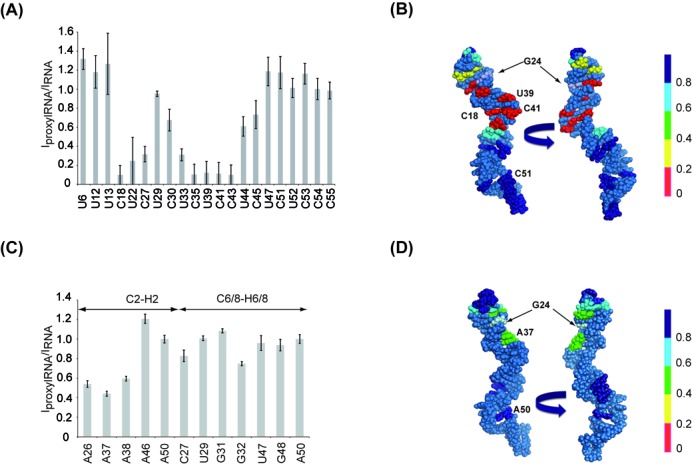
Effect of site-specific spin-labeled RNA analyzed by NMR. (A) Bar graph of intensity ratio between the spin-labeled RNA (IproxylRNA) and the free form RNA (IRNA), normalized to C54, extracted from MLEV experiments, versus the primary sequence of the RNA. The quantification of residues C18, U22, C35, U39, C41 and C43 was not feasible due to the disappearance of the corresponding resonances. The corresponding ratios were estimated by measuring values at the same frequencies as the resonances observable in the wild-type RNA. (B) Sphere representation of the RNA structure colored according to the intensity ratios extracted from MLEV experiments. The spin-labeled G24 residue is highlighted in light blue. (C) Bar graph of intensity ratio between the (G1-A23)-(G246TGproxyl–C55) RNA and the free form RNA, normalized to A50, extracted from HSQC experiment, versus the primary sequence of the RNA. (D) Sphere representation of the RNA structure colored according to the intensity ratios extracted from HSQC experiments. The spin-labeled G24 residue is highlighted in light blue.