
Figure 6.
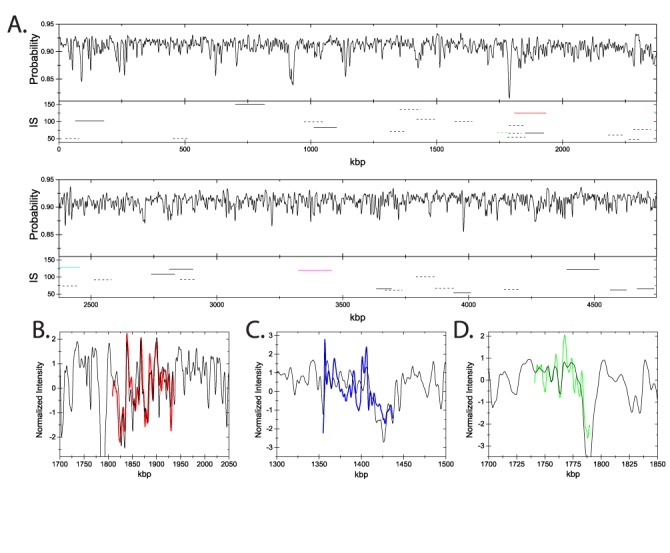
(A) The theoretical probability ptheory(i) for YOYO binding to the full genome of E. coli strain CCUG 10979, calculated using the transfer matrix approach discussed in the Materials and Methods section. Horizontal lines represent the location of the best fits of 36 experimental E. coli fragments; the associated IS values are also displayed. Solid horizontal lines correspond to a P-value below 10% and dashed lines have a P-value above 10%. The five colored horizontal lines correspond to traces which are detailed in panels B–D, see also Figure 8. The best fit (colored curves) of three experimental fragments matched to the theoretical trace (black curves): (B) a representative fragment with a large best cross-correlation 
 value (0.771) and a small P-value (0.09 %); (C) a representative fragment with a small
 (0.670) and a large P-value (37.1%); (D) a representative fragment with a large
 (0.877) and a large P-value (33.3%). The colors of the fits correspond to the colors of the horizontal lines in (A).