
Figure 7.
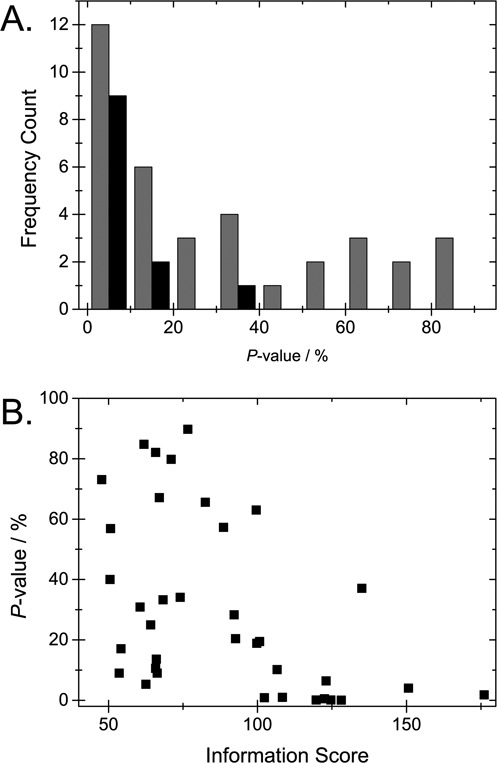
(A) Histogram (gray) of P-values obtained when fitting 36 experimental fragments from the E. coli strain CCUG 10979 to its theoretical barcode, and the 12 fragments with an IS above 100 (black). (B) Plot of the IS versus the P-value for the 36 fragments.