
Figure 8.
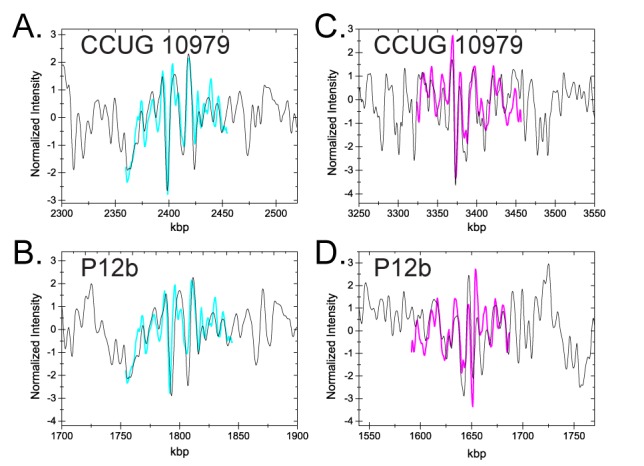
Fragments fitted to the theoretical genomes of CCUG 10979 and P12b, respectively. (A and B) A fragment with a good fit to both the correct strain CCUG 10979 and the P12b strain. (A) Location of one fragment (cyan curve) on the genome of the correct strain CCUG 10979 (black curve) with a P-value of 0.04% and a best cross correlation value of 
 . (B) The same fragment as in (A) (cyan) located on strain P12b (black) with a P-value of 0.12% and
 . (C and D) A fragment with a good fit to CCUG 10979 and a bad fit to P12b. (C) Location of one fragment (magenta) on the genome of the correct strain CCUG 10979 (black curve) with a P-value of 0.13% and
 . (D) The same fragment as in (C) (magenta) located on strain P12b (black) with a P-value of 23% and
 .
.