
Figure 9.
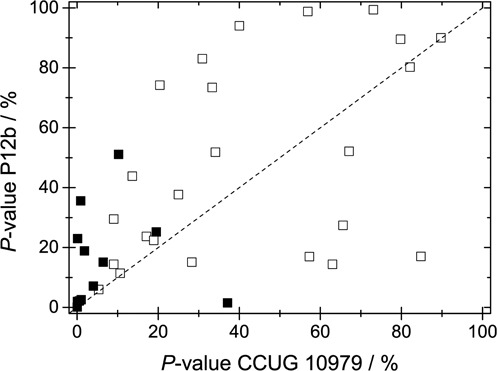
P-value for all 36 fragments (squares) fitted to the correct strain CCUG 10979 (x-axis) and the reference strain P12b (y-axis). The 12 fragments with an IS above 100 are shown as full symbols. The dashed line corresponds to equal values for both strains.