
Figure 4.
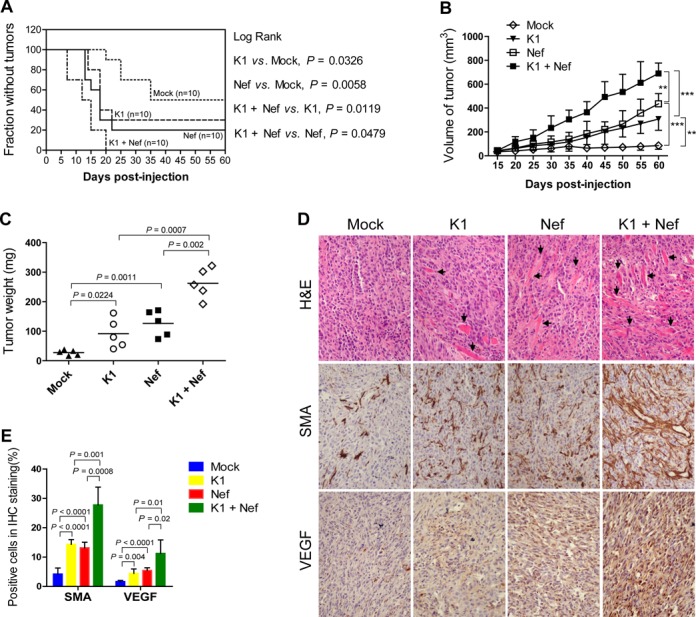
Nef promotes K1 induction of tumors in nude mice. (A) A Kaplan–Meier plot for the time until the appearance of palpable tumors. EA.hy926 cells transduced by K1, Nef or both were s.c. injected into the left flanks of nude mice. The palpable tumor appearances of mice were daily monitored for 60 days. (B) Nef enhanced K1-induced tumorigenesis indicated by tumor size. The sizes of tumors from nude mice that treated as in (A) were determined by two-dimensional caliper measurements. Data represent mean ± SD. n = 5 tumors per group. Two independent experiments were performed and gave similar results. ** and *** indicate P < 0.01 and P < 0.001 for Student's t-test, respectively. (C) Nef enhanced K1-induced tumorigenesis indicated by tumor weight. The tumors from nude mice that treated as in (A) were removed and weighed. Scatter plots represent the weight of independent tumors from different groups. Data represent mean ± SD, each group with five tumors (n = 5). Two independent experiments were performed and similar results were obtained. (D) H&E staining analysis of histological features (top; original magnification, ×100) and immunohistochemical staining analysis of the expression of SMA and VEGF (middle and bottom; original magnification, ×200) in tumor tissues from nude mice treated as in (A). Black arrows point to neovascularization and hemorrhagic foci. (E) Quantification of results in (D).