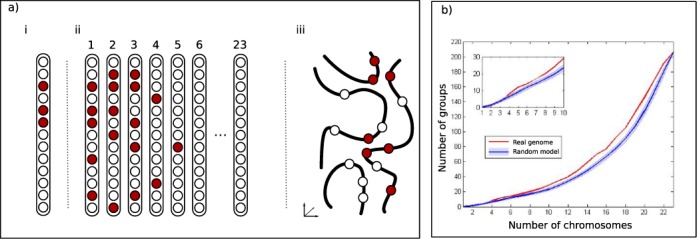
Figure 1.

Proximity criteria and pathway concentration. (a) Criteria for chromosome concentration of co-functioning genes. Circles correspond to genes and the red circles are all the members of a group with a common function. (i): concentration within a chromosome (intra-chromosomal). Here clustering/concentration is gauged based on pairwise linear distance (in base pairs or in the number of intervening genes) between co-functioning genes. (ii): dispersal across chromosomes (inter-chromosomal). Out of the 23 pairs of chromosomes, 18 do not contain the group's genes, so this group is concentrated in few chromosomes. This measure takes into account only the chromosomes on which the co-functioning genes reside and ignores the relative locations within each chromosome. (iii): concentration in the 3D space. Curved lines show positions of chromosomal segments in space, with the genes on them. The group is concentrated in space. By identifying the chromosome each segment belongs to, one can distinguish between proximity of inter- and intra-chromosomal gene pairs, and analyze them separately. (b) Pathway concentration in few chromosomes. For each number j of chromosomes, the plots show the number of pathways whose genes reside in at most j chromosomes. Plots for the real genome (red curve) and for an average over 106 random genomes (blue curve) are shown. The shaded area around the blue curve shows ±1 standard deviation. Inset: Zoom in on the region of a small number of chromosomes.
