
Figure 3.
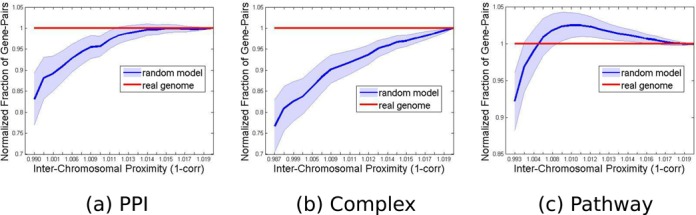
Spatial proximity between inter-chromosomal gene pairs from the same functional group. The cumulative distribution function (cdf) of inter-chromosomal proximity between genes from the same group was computed for real and randomized genomes. The plot shows each cdf divided by the cdf of the real genome. As a result the real genome curve has a constant y-value of 1. Red: real genome, blue: average over 105 random genomes. The light blue bands show ±1 standard deviation. (a) PPIs; (b) Complexes; (c) Pathways. The x-axis units are 1 minus the correlation between the normalized Hi-C contact profiles of the regions containing the gene pairs, so that smaller values reflect higher correlation and shorter distances.