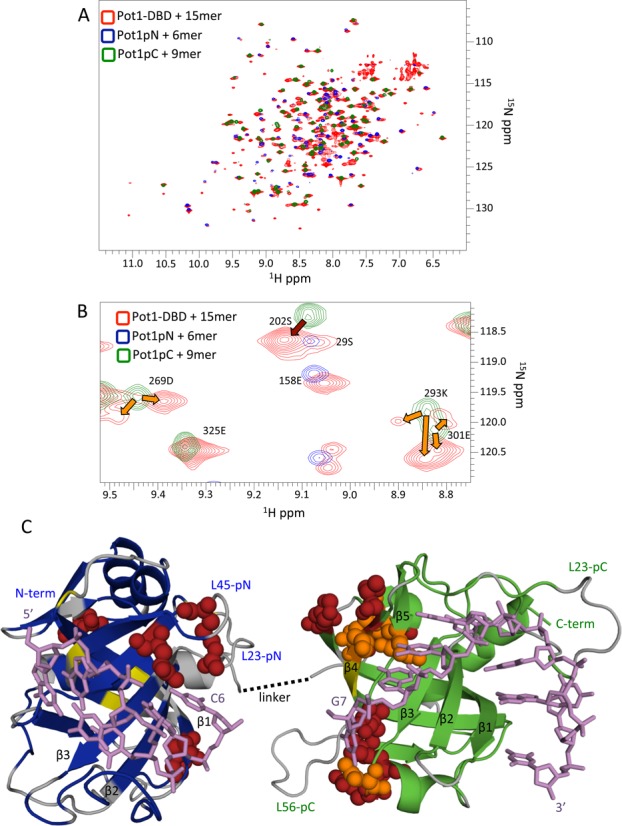
Figure 1.

Comparison of subdomain and Pot1-DBD+15mer spectra shows global similarity except at a putative subdomain interface. (A) The 15N -HSQC spectrum of Pot1-DBD (red) bound to 15mer overlays well with the spectra Pot1pN (blue) and Pot1pC (green) bound to 6mer and 9mer, respectively. (B) An enlarged portion of the superpositioned spectra in (A) shows examples of residues that change chemical environment (dark red arrow) and residues that experience multiple distinct chemical environments in Pot1-DBD+15mer, resulting in peak splitting (orange arrows). (C) Altered residues cluster at a putative subdomain interface when mapped onto crystal structures of Pot1pN+6mer (PDB ID: 1QZH) and Pot1pC+9mer (PDB ID: 4HIK). Amino acids with amides shifted >0.05 ppm are shown as dark red spheres and amino acids with split peaks in Pot1-DBD are shown as orange spheres. Unshifted amino acids are colored blue and green for Pot1pN and Pot1pC, respectively. Amino acids that are unassigned in both Pot1-DBD+15mer and subcomplex spectra are colored gray and amino acids unassigned only in Pot1-DBD are colored yellow. DNA is represented by violet sticks. This panel was created using MacPyMOL (42). See supplementary Table S1 for a list of shifted amino acids.
