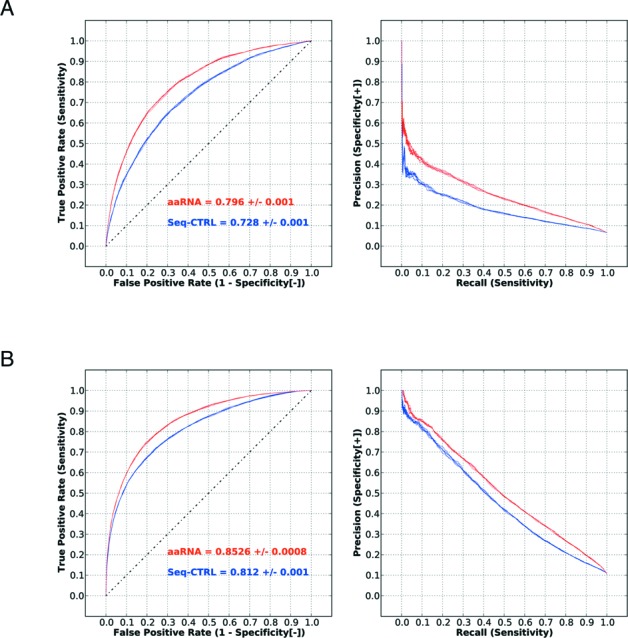
Figure 2.

Performance of all features. (A) Non-ribosomal dataset. Blue curves indicate the performance of the control method (sequence features used in the SRCPred method (12)), and red curves show the performance when all features are used. (B) Full dataset. By varying the output cutoff of the classifier, the TP rate against the FP rate is plotted on the ROC curve for each cutoff value. Similarly, the precision rate against the TP rate is plotted on the PR curve for each cutoff value.
