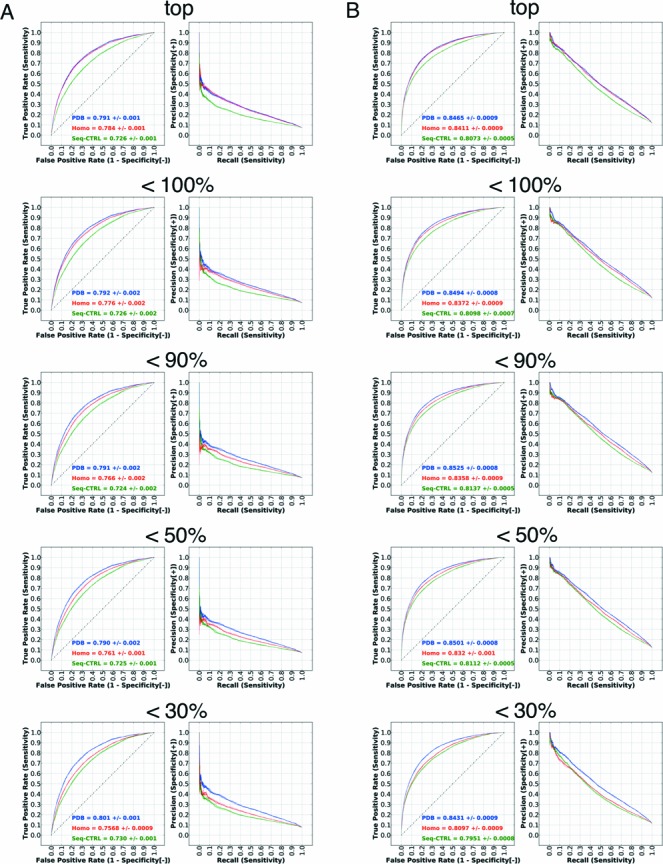
Figure 3.

Performance evaluation using homology models. The left panel (A) shows the performance on the non-ribosomal set and the right panel (B) shows the performance on the full set. The figure shows the performance for the top, <100%, <90%, <50% and <30% homologs in subfigures. Since the number of residues generally decreases as the threshold is lowered, performance is only comparable within a given set. The performance using bound structures, homology models and sequence-based control are indicated by ‘PDB’, ‘Homo’ and ‘Seq-CTRL’.
