
Figure 5.
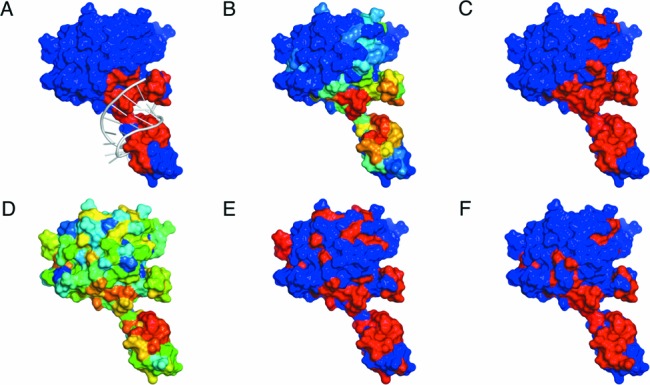
Comparison of prediction results of aaRNA, BindN+ and SRCPred. The figure shows the Csy4-crRNA complex (PDB entry 4AL5). (A) actual contact pattern of the complex. Red colored residues are in RNA contact under a 3.5 Å cutoff. (B) mapping of aaRNA binary binding propensities onto residues, with high (low) colored red (blue). (C) residues in red are positively predicted by the aaRNA under a stringency of 85% expected specificity. (D–E) show the raw and the threshold-calibrated (85% expected specificity), respectively, for BindN+ colored in the same way. (F) prediction results for SRCPred for any di-nucleotide under a 0.05 expected precision.