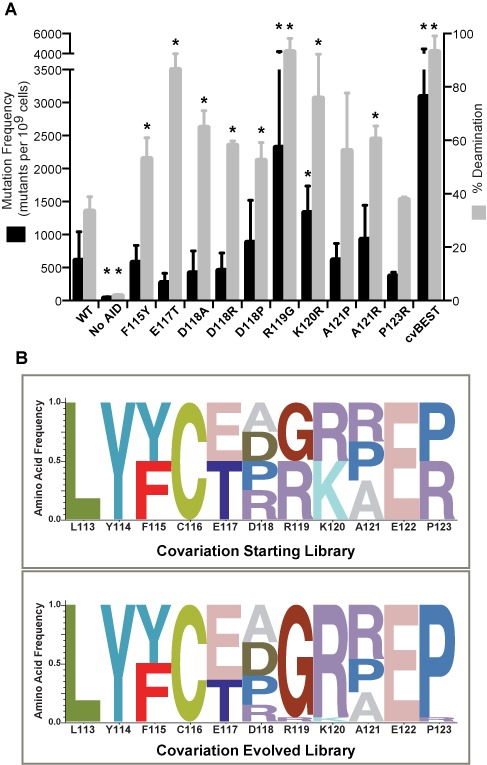
Figure 4.

Characterization of selected AID variants. (A) Amino acids which evolved to be greater than 20% of the total G3 library at each position were characterized for their activity using the rifampin mutagenesis assay and the in vitro deamination assay. The data are represented as in Figure 1. Experimental data that are significantly different from the AID-WT (P < 0.05) are highlighted with an asterisk (*). At the right of the plot are shown the results for cvBEST, which was selected based on covariation of the best amino acids at each position as described below. (B) To examine the impact of covariation of multiple positions in the loop, a starting pooled library was generated containing the WT amino acid at each position along with any other amino acid that resulted in >20% of the counts in G3 at that position. The covariation library underwent six cycles of selection and at the conclusion of selection, individual colonies were sequenced and the frequency of each amino acid variant was cataloged. The results are summarized as a normalized logo plot on bottom panel.
