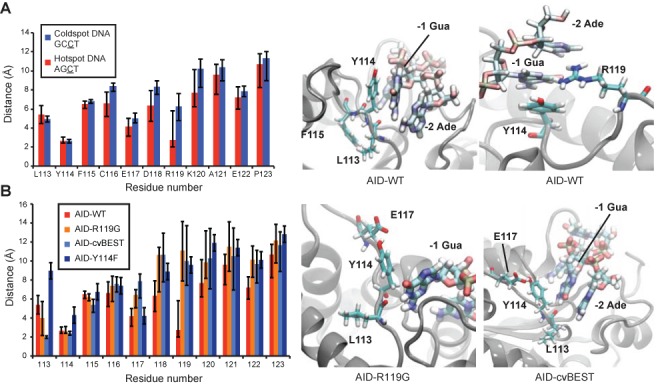
Figure 6.

MD simulations of AID interactions with DNA. (A) Residue-to-DNA time-averaged distances between targeting loop residues and the hotspot or coldspot DNA sequences. Representative images showing the interactions of Leu113, Tyr114, Phe115 and Arg119 to the hotspot DNA are depicted in the two panels at right. (B) Residue-to-DNA time-averaged distances between the AID-WT, Y114F, R119G or cvBEST loops and hotspot DNA, calculated from the sampled distances in the 120 ns simulation trajectories. Notably, the Leu113 backbone oxygen forms closer interactions in the R119G and cvBEST mutants. Snapshots of R119G and cvBEST interacting with the hotspot DNA are shown in the right two panels.
