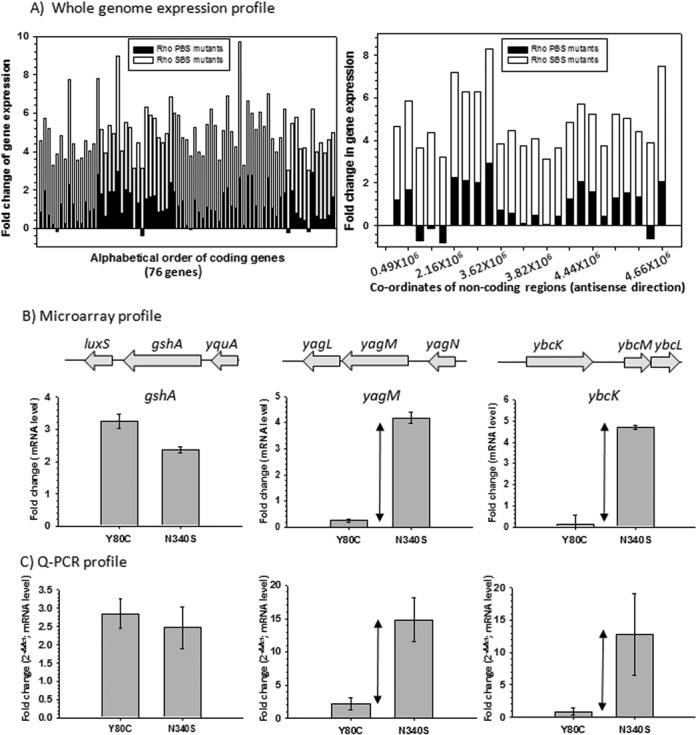
Figure 2.

(A) Fold changes in gene expression for the genes that are less affected in PBS mutants were overlaid onto the fold changes in gene expression of the same genes obtained in the presence of SBS mutants. In these plots, mean values of fold changes of two different PBS mutants (Y80C and F62S) were overlaid onto the mean values obtained from N340S and G324D SBS mutants. Left panel depicts data from coding genes, whereas the right panel is for non-coding regions along the antisense direction. (B) Validation of the microarray data of the selective genes by qRT-PCR. Upper panel shows the microarray profiles of the indicated genes in the presence of Y80C and N340S Rho mutants. Bottom panel validates the expression profiles of the same genes using qRT-PCR. Fold changes in qRT-PCR were expressed in terms of CT values (threshold cycle) as per the convention, details of which are given in the Materials and Methods section. Error bars were calculated from the data obtained from RNA preparations of two independent colonies. Double-sided arrows indicate the differences in gene expression levels in the presence of PBS and SBS mutants.
