
Figure 3.
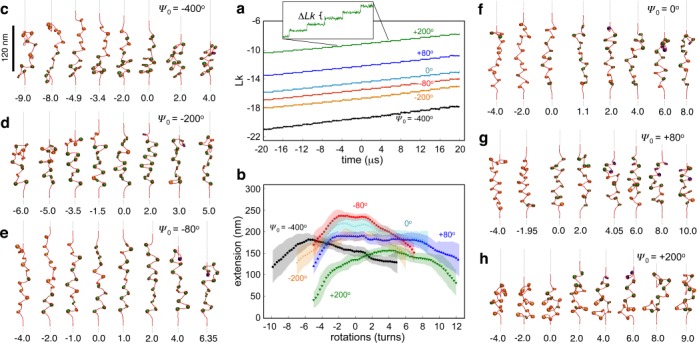
Ψ0-dependent torsional response of nucleosome arrays. (a) Time evolution of the linking number and (b) extension-rotation curves of arrays with different Ψ0. Shaded regions represent standard deviations. (c–h) Representative conformations of arrays during twisting for different Ψ0 values. Numbers at the bottom indicate the number of imposed turns n. SI movies provide a higher time resolution of these conformational changes.