
Figure 5.
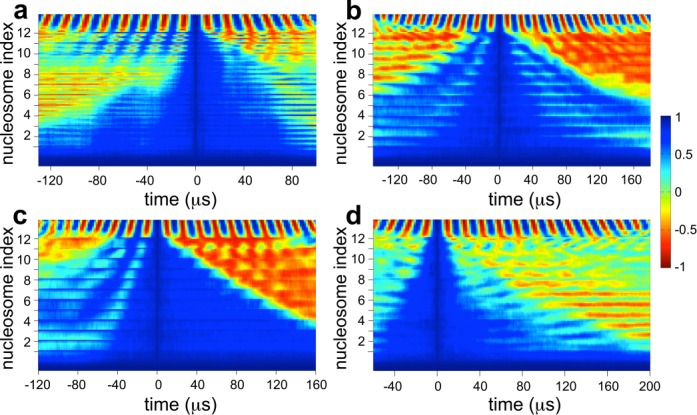
DNA twist propagation along arrays. C(t,i) landscape of arrays with (a) Ψ0 = −400°, (b) −80°, (c) 80° and (d) 200°. The location of each nucleosome in the array is marked on the y-axis; the end linker DNA being twisted is attached to the last nucleosome 12, and t = 0 corresponds to arrays at the onset of twisting. Sixteen microsecond represents 1 rotation.