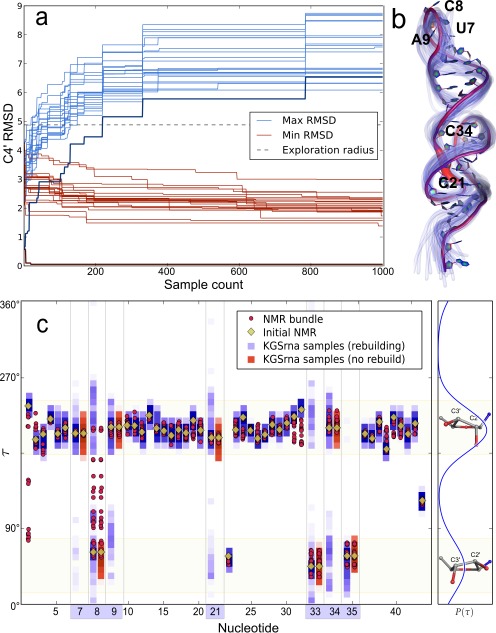
Figure 3.

Sampling properties of 1000 KGSrna samples illustrated with the TYMV pseudoknot. Sampling was started from model one of the NMR bundle with pdb id 1A60, and the sampling-radius was set to 4.6 Å. (a) The evolution of the minimum (red curves) and maximum (blue curves) C4′ RMSD to each structure in the NMR bundle. Bold curves correspond to the starting structure. (b) The backbone of the initial structure indicating varying degrees of ridigity for torsional degrees-of-freedom. A thicker and more red-shifted backbone indicates higher variances for those degrees-of-freedom. The backbones of 25 randomly chosen KGSrna samples are shown in translucent blue to reflect flexibility. (c) Distributions of the τ-angles in the NMR-bundle and the KGSrna samples. Ribose conformations of the 1000 samples are displayed vertically as normalized color-coded histograms with a bin-width of 1.8°. Rebuild perturbations recover the full range of τ-angles in the NMR bundle for free nucleotides (highlighted on the x-axis), as shown by residue 8. The distribution from which τ-angles are sampled is shown on the right. The large peak corresponds to C3′-endo conformations and the smaller one to C2′-endo conformations.
