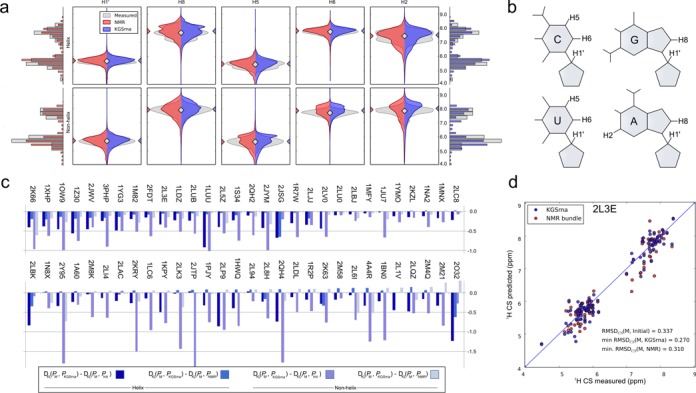
Figure 4.

Agreement between measured 1H chemical shifts and those back calculated from KGSrna and NMR 3D structures. (a) Depicted chemical shift values are aggregated by proton type in helical (top) and non-helical regions (bottom). The discrete distributions were smoothed with a Gaussian kernel density estimator (bandwidth n−0.2 where n is number of data points) for easier visualization. Measured values were taken from the BMRB and KGSrna samples and NMR bundle values were back calculated using NUCHEMICS. Marginal distributions are shown as histograms with bin-widths of 0.275 ppm. (b) The symmetric Kullback–Leibler divergence indicates the degree of similarity of two distributions and is calculated for the marginal distributions of measured-to-KGSrna, measured-to-initial and measured-to-NMR. The differences between measured-to-KGSrna, measured-to-initial and measured-to-NMR are shown in the bar plot. A negative value indicates better agreement of the ensemble of KGSrna 3D structures with measured values than its comparison 3D structures. (c) Predicted 1H chemical shifts calculated from the 3D structures from the KGSrna ensemble and the NMR bundle compared to the measured values of the 32nt P2a-J2a/b-P2b (helix-bulge-helix) of human telomerase RNA (pdb id 2L3E). The data points are expected to lie along a 45° line if measured 1H CS are accurately predicted.
