
Figure 2.
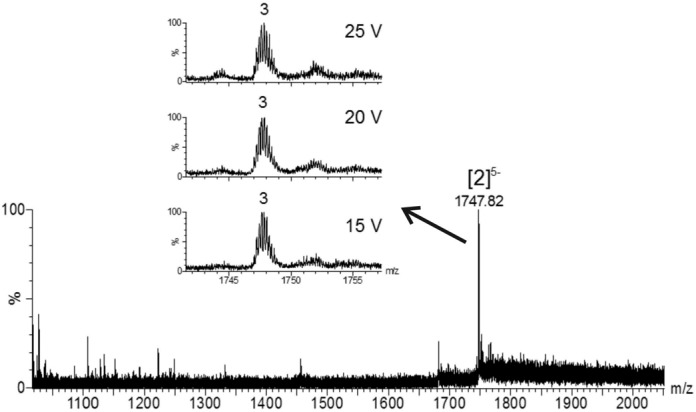
Electrospray mass spectrum of (AGG)4A in the presence 150 mM ammonium acetate. The final single strand RNA concentration was 18 μM. 10% v/v of methanol was added 1 h before measurement. The peak annotation [n]z- indicates the number of strands (n) and the total charge (z). The distribution of the number of ammonium ions preserved in the structure is shown in the inset. The distribution is presented at three bias voltages.