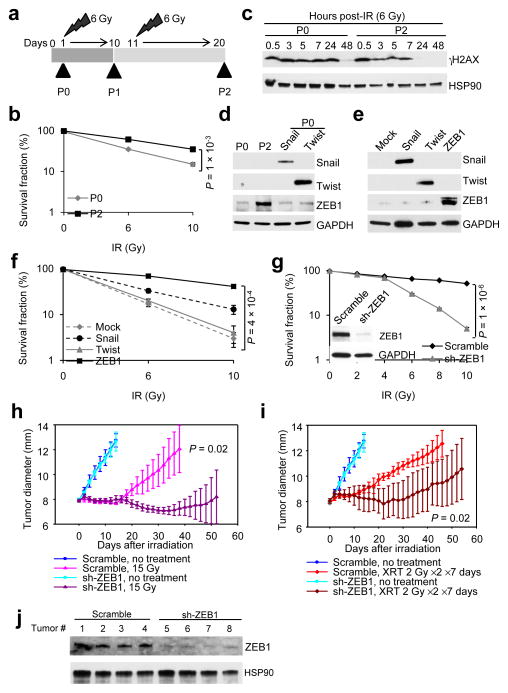
Figure 2. ZEB1 is upregulated in radioresistant cancer cells and promotes tumor radioresistance.
(a) Schematic representation of generation of a radioresistant subline (SUM159-P2) from parental SUM159 cells (SUM159-P0).
(b) Clonogenic survival assays of SUM159-P0 and SUM159-P2 cells. n = 3 wells per group.
(c) Immunoblotting of γH2AX and HSP90 in SUM159-P0 and SUM159-P2 cells treated with 6 Gy IR.
(d) Immunoblotting of Snail, Twist, ZEB1 and GAPDH in SUM159-P0 and SUM159-P2 cells. SUM159-P0 cells transfected with Snail or Twist were used as positive controls.
(e) Immunoblotting of Snail, Twist, ZEB1 and GAPDH in SUM159-P0 cells transduced with Snail, Twist or ZEB1.
(f) Clonogenic survival assays of SUM159-P0 cells transduced with Snail, Twist or ZEB1. n = 3 wells per group.
(g) Clonogenic survival assays of SUM159-P2 cells transduced with ZEB1 shRNA (sh-ZEB1). Inset: immunoblotting of ZEB1 and GAPDH. n = 3 wells per group.
(h, i) Tumor size of mice bearing control (scramble) or ZEB1 shRNA-transduced SUM159-P2 xenografts. Tumors were locally irradiated with 15 Gy single dose (h) or 2 Gy fractionated dose (XRT) twice per day for 7 consecutive days (i). n = 5 mice per group. General linear model multivariate analysis was performed to determine statistical significance.
(j) Immunoblotting of ZEB1 and HSP90 in tumor lysates.
Data in b, f, g, h and i are the mean of biological replicates from a representative experiment, and error bars indicate s.e.m. Statistical significance in b, f and g was determined by a two-tailed, unpaired Student’s t-test. The experiments were repeated 3 times. The source data can be found in Supplementary Table 3. Uncropped images of blots are shown in Supplementary Figure 7.

