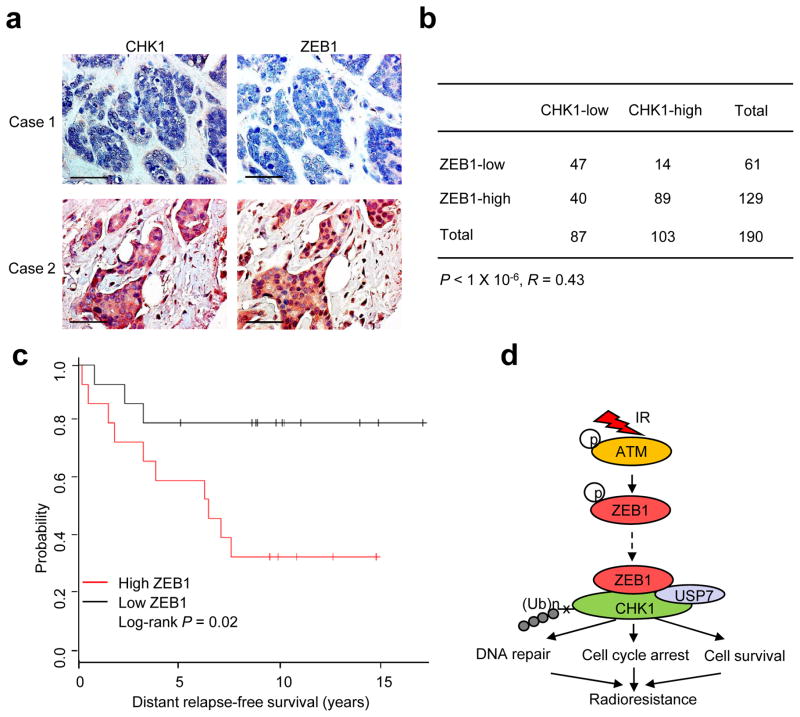
Figure 8. ZEB1 correlates with CHK1 protein levels and poor clinical outcome in human breast cancer.
(a) Immunohistochemical staining of ZEB1 and CHK1 in representative carcinoma specimens on the NCI breast cancer progression tissue microarrays. Brown staining indicates positive immunoreactivity. Scale bar: 50 μm.
(b) Correlation between ZEB1 and CHK1 protein levels in human breast tumors. Statistical significance was determined by a χ2 test. R is the correlation coefficient.
(c) Kaplan-Meier curves showing the distant relapse-free survival of patients with high or low expression of ZEB1 in their breast tumors. Statistical significance was determined by a log-rank test.
(d) The working model of regulation of radiosensitivity and DDR by ZEB1.

