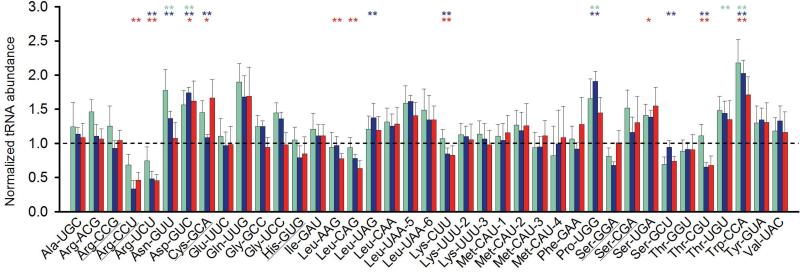
Figure 1.
Variations in the tRNA abundance of L. lactis grown at different growth rates. For comparison the slowest growth rate of 0.15 h−1 is set to 1, which is represented by the dotted horizontal line. The tRNA abundance at a growth rate of 0.3 h−1(green), 0.5 h−1 (blue) and 0.6 h−1 (red) are compared to the tRNA abundance at 0.15 h−1. * denotes p < 0.05 and ** denotes p < 0.01. tRNAs reading rare codons are underlined (for more details see Materials and Methods section).

