
Figure 4. hRPA binding to 3′-Cy3-(dT)L increases the average Cy3 fluorescence intensity and the Cy3 fluorescence fluctuations.
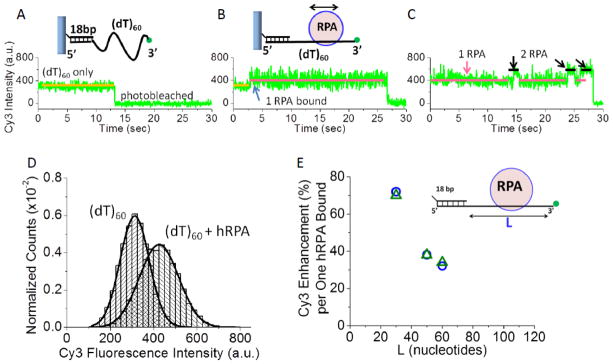
(A) Representative single molecule TIRF time trace of the Cy3 fluorescence from a single DNA molecule (3′-Cy3-(dT)60) attached to the surface via a biotin-neutravidin-biotin-18 bp handle. (B) Upon addition of hRPA (37 pM), an increase in average Cy3 fluorescence and fluorescence fluctuations occurs due to binding of a single hRPA. (C) At much higher hRPA concentrations (370 nM), transient binding of a second hRPA molecule can be observed. (D) The Cy3 fluorescence intensity distributions for (3′-Cy3-(dT)60) (n=29) and upon one hRPA bound to the same 3′-Cy3-(dT)60 molecules shows the increase in both Cy3 fluorescence and Cy3 fluorescence fluctuations. The 34% increase in Cy3 intensity indicates a single hRPA bound as shown by ensemble studies (Figure S6). (E) The average Cy3 fluorescence enhancement per one hRPA bound decreases with increasing ssDNA length, L. This was observed in both ensemble (blue circles) and smTIRF studies (green triangles).