Figure 1.

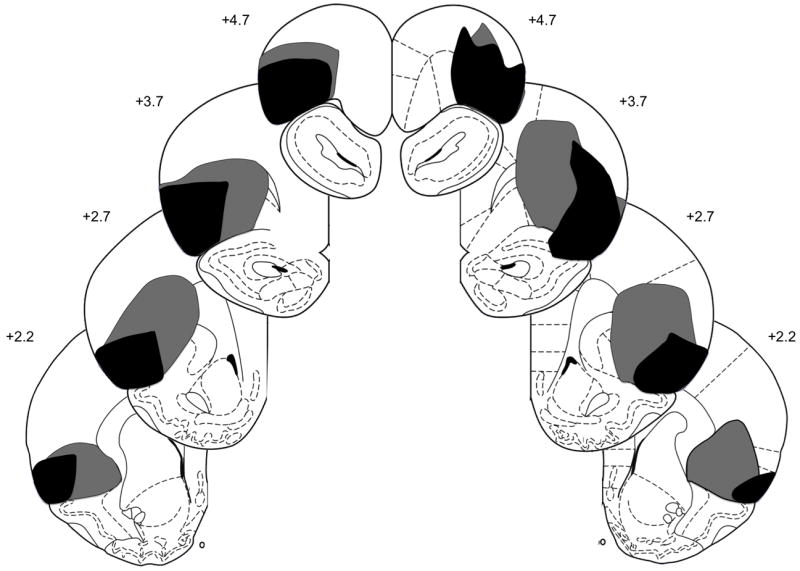
Schematic representation of orbitofrontal cortex (OFC) lesions showing the minimum (black) and maximum (gray) amount of neuronal damage. Coronal sections are 4.70 mm to 2.20 mm relative to bregma. Diagrams from Paxinos and Watson [19].

Schematic representation of orbitofrontal cortex (OFC) lesions showing the minimum (black) and maximum (gray) amount of neuronal damage. Coronal sections are 4.70 mm to 2.20 mm relative to bregma. Diagrams from Paxinos and Watson [19].