
Figure 2.
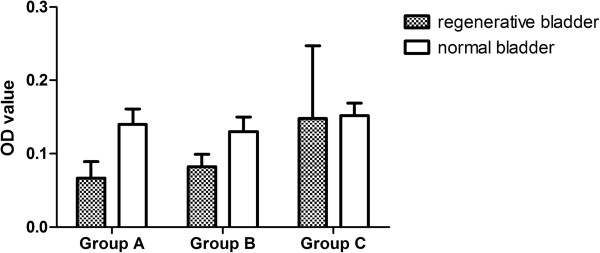
Compare of OD value. The OD value of regenerated tissue was 0.067 ± 0.022 in group A, 0.082 ± 0.017 in group B, and 0.148 ± 0.099 in group C. Compared with normal bladder (0.140 ± 0.021 in group A, 0.130 ± 0.020 in group B, 0.152 ± 0.017 in group C), groups A and B were significantly different with normal bladder (p < 0.05), while there was no significant difference in group C and normal bladder (p > 0.05).