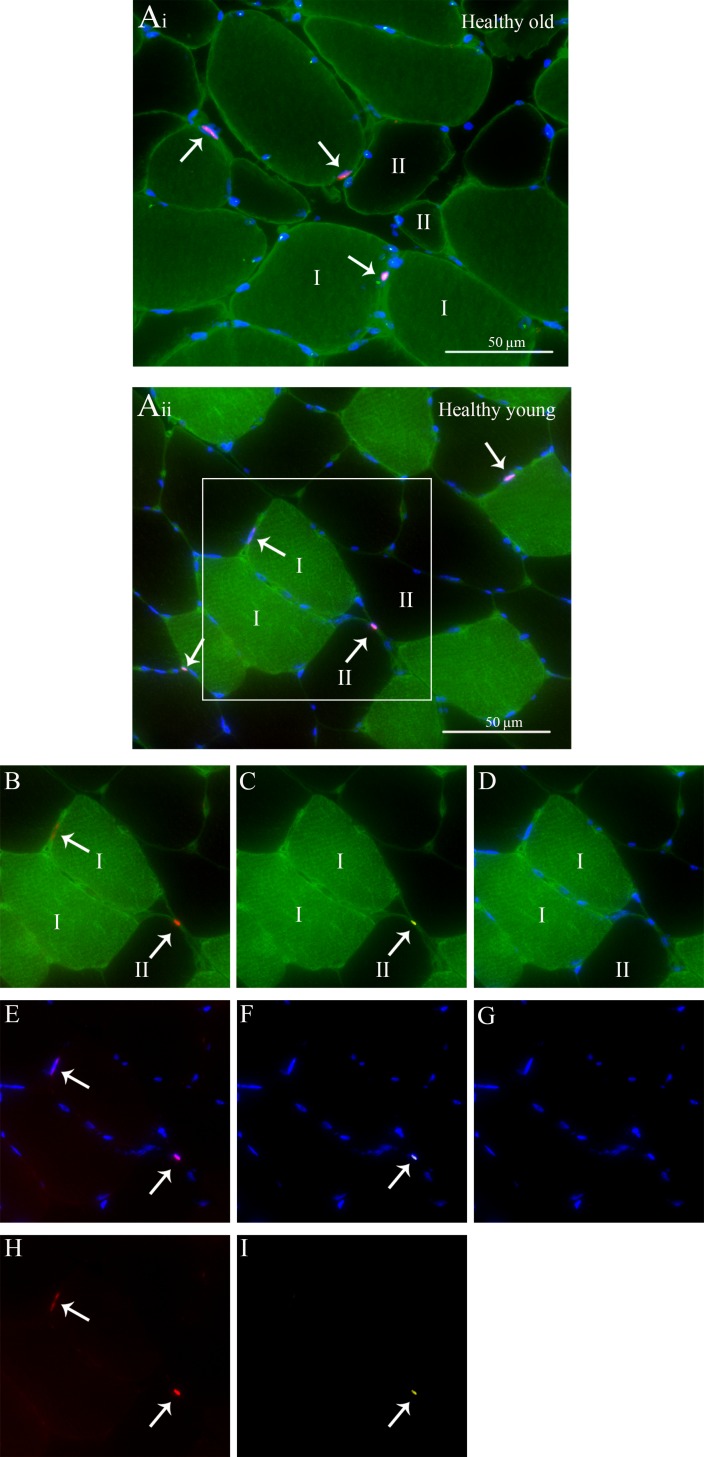
Fig. 2.
Representation of fiber-type-specific analyses of skeletal muscle satellite cell (SC) content and myostatin in both a healthy old (a i) and young (a ii) man. a i-ii MHCI (green) + laminin (green) + Dapi (blue) + Pax7 (red) + myostatin (yellow) staining. b MHCI + laminin + Pax7. c MHCI + laminin + myostatin. d MHCI + laminin + Dapi. e Dapi + Pax7. f Dapi + myostatin. g Dapi only. h Pax7 only. i Myostatin only. Arrows point at the SCs

