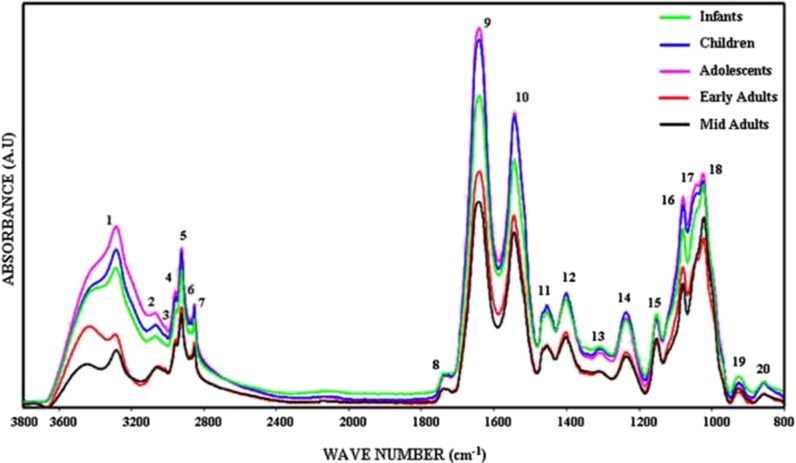
Fig. 3.
The representative infrared spectra of healthy BM-MSCs from different age donors. Green line represents infant BM-MSCs; blue line represents children BM-MSCs; pink line represents adolescent BM-MSCs; red line represents early adult BM-MSCs; and black line represents mid adult BM-MSCs in the 3,800–800 cm−1 region (the spectra were normalized with respect to the amide A band) (color figure online)

