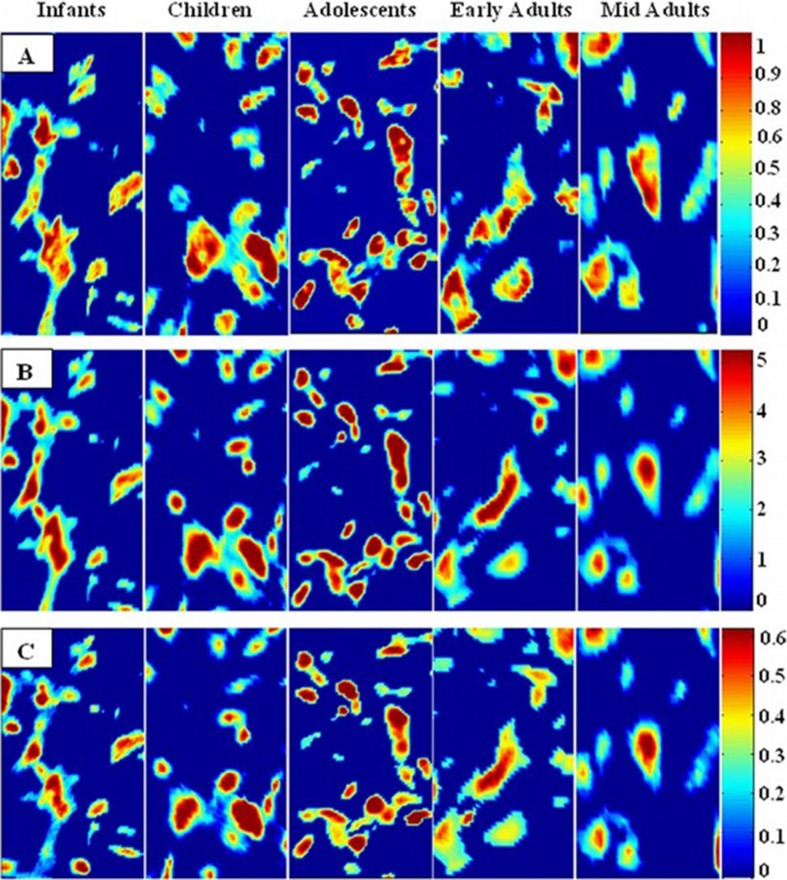
Fig. 6.
Spectral image maps that reflect distribution of lipids, proteins, and nucleic acids in the BM-MSCs from five different age groups. These maps were derived respectively by taking the peak integrated areas of a CH2 antisymmetric stretching bands of lipids, b amide I band of proteins, and c PO2 − antisymmetric stretching bands of nucleic acids

