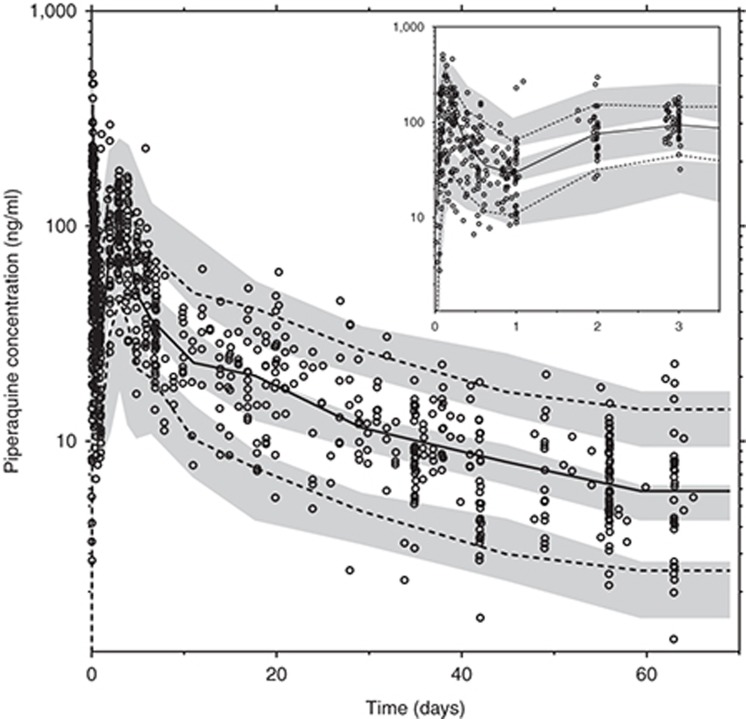
Figure 2.
Prediction-corrected visual predictive check of the final model describing piperaquine pharmacokinetics in P. vivax malaria. Open circles represent the observed piperaquine concentrations. Solid black line represents the 50th percentile of the observations, and dash lines represent the 5th and 95th percentiles of the observations. Gray areas represent the 95% confidence intervals of the simulated 5th, 50th, and 95th percentiles from 1,000 simulations. The inset shows a prediction-corrected visual predictive check for the first 3 days of piperaquine treatment.

