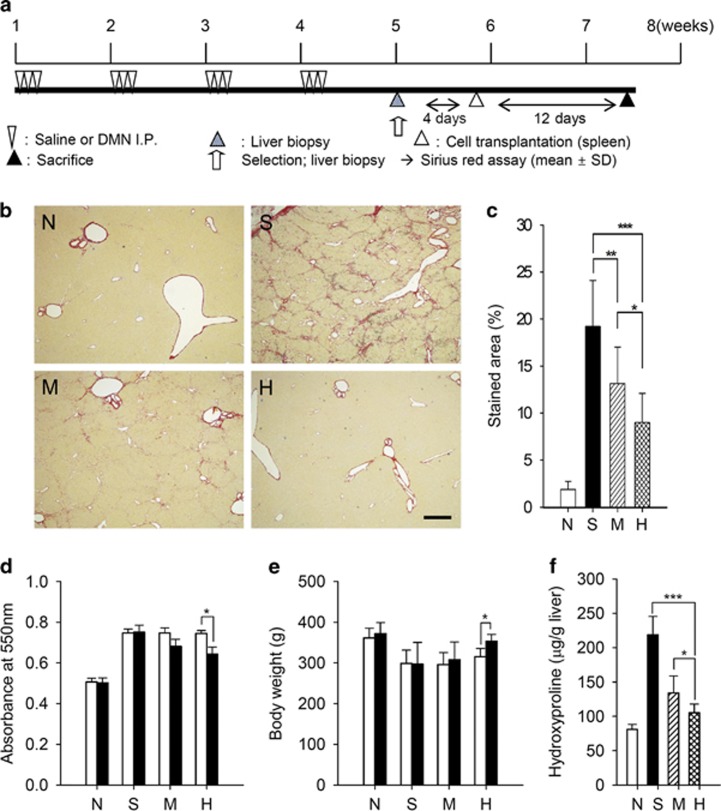
Figure 2.
Assessment of liver fibrosis in MSC/HGF-transplanted rats and controls. (a) Diagram of the treatment protocol. (b) Extracellular deposition of collagen fibers stained with Sirius Red. Scale bar=0.5 mm. (c) Quantification of collagen by image analysis. (d, e) Collagen content and body weight quantified before (white bar) and 12 days after transplantation (black bar). (f) Hydroxyproline content. Normal rats (N), control fibrotic animals (S), fibrotic animals transplanted with MSCs (M) or MSCs/HGF (H). Data represent mean±s.d. for each group (*P<0.05, **P<0.01, ***P<0.005).

