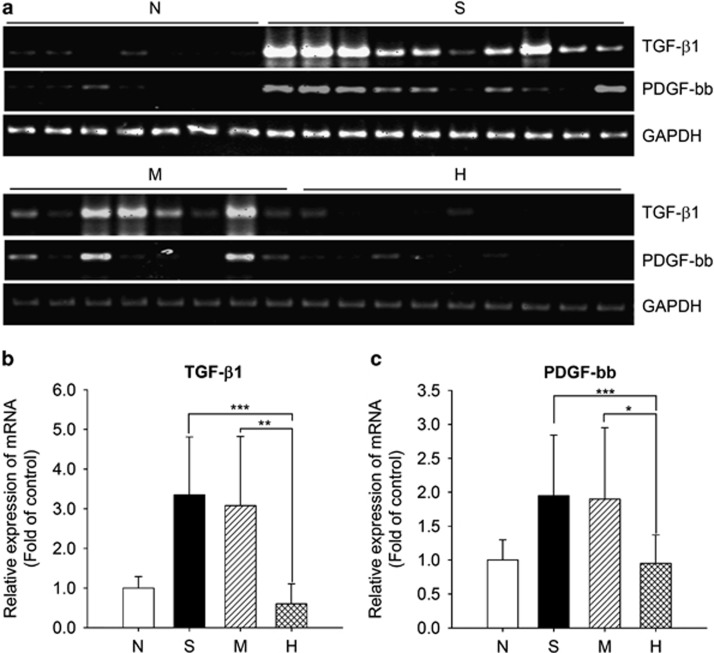
Figure 5.
Analysis of profibrogenic cytokine expression. (a) Detection of TGF-β1 and PDGF-bb mRNA in individual rats by RT–PCR. (b, c) Mean relative expression levels of TGF-β1 and PDGF-bb in liver tissues from normal rats, N; control fibrotic animals, S; or fibrotic animals transplanted with MSCs, M, or MSC/HGF, H. Data are normalized to GAPDH expression levels and represent the mean±s.d. for each group (*P<0.05, **P<0.01, ***P<0.005).

