
Figure 3.
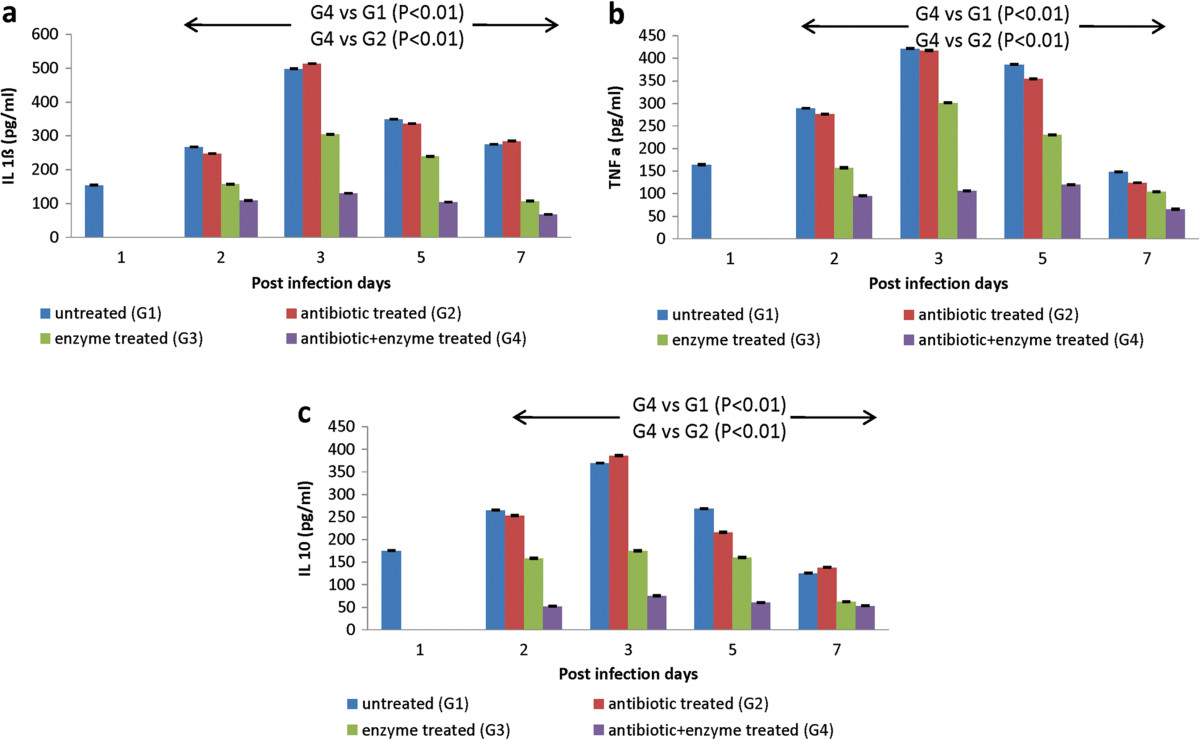
Cytokine levels during acute lung infection: a) IL 1ß b) IL 10 c) TNF a levels (pg/ml) in lungs of mice infected via intranasal route with K. pneumoniae B5055 and treated with gentamicin (1.5 mg/kg) and/or depolymerase (50 μg). No sample was taken and processed on day 1 in the treated groups. G1, G2, G3, G4 represent Groups 1, 2, 3, 4. Arrows indicate significant reduction in cytokine levels between groups on days 2, 3, 5, 7. Error bars represent standard deviation (S.D) from four independent values.