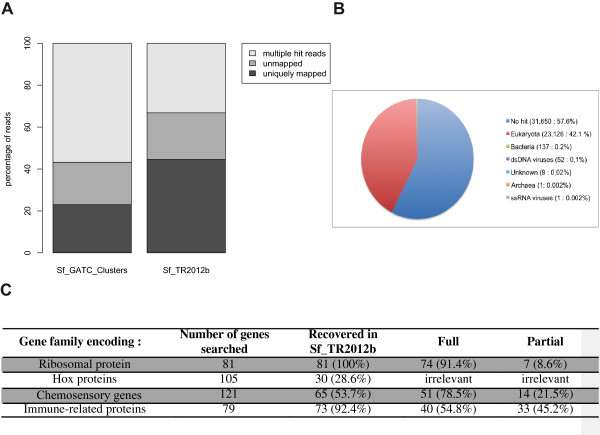
Figure 1.

Content of the reference transcriptome. A. Barplot representing the percentages of multiple hit reads, unmapped reads and uniquely mapped reads, as provided by Bowtie, when aligning an RNAseq library against either the Sf_454_clusters assembly or the Sf_TR2012b assembly. The percentages obtained are the average of four independent experiments. B. Pie chart representing the number and percentage of contigs from Sf_TR2012b grouped by their best blastx hit against nr. Number of contigs and percentage of the total are represented. C. Synthetic table representing the number of genes found per family in the Sf_TR2012b assembly. The number of full and partial transcripts for Hox-domain proteins is irrelevant because the only conserved part is the homeodomain itself.
