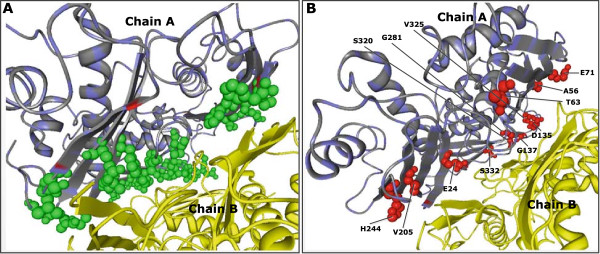
Figure 6.

Comparison of enhancer and PresCont service of same specificity on the protein with PDB-Entry 1QM4. (A) Green spheres on the left show the interface surface residues correctly predicted by both tools. (B) Red spheres on the right indicate additional true positives of the enhancer.
