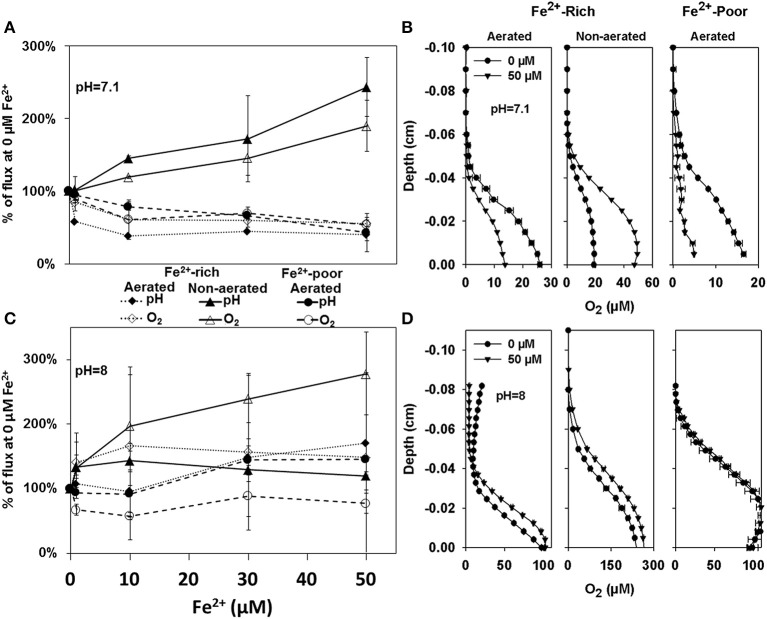
Figure 3.
Percent change in O2 fluxes and pH gradients calculated from microprofiles measured in cyanobacterial biofilms grown from enrichment cultures from the Fe2+-rich and Fe2+-poor reactors at pH 7 (A) and pH 8 (C). The shown fluxes are averaged measurements in 3 different biofilms with 3–4 steady state profiles each. Example of profiles from which these fluxes were calculated are shown in (B,D), respectively. Depth zero corresponds to the biofilm surface.

