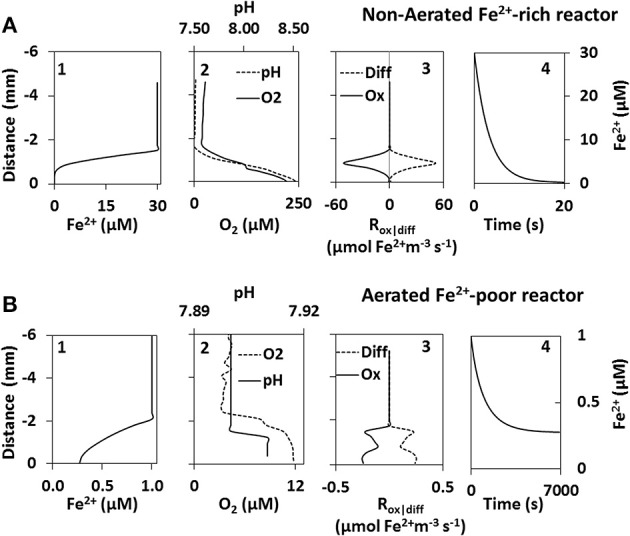
Figure 4.

Fe2+ model results of the non-aerated Fe2+-rich (A) and aerated Fe2+-poor (B) reactors. Steady state Fe2+ profiles above cyanobacteria biofilms (graph 1) were calculated using microprofiles of O2 and pH measured in-situ (graph 2). Steady state was achieved once Fe2+ consumption by abiotic oxidation (Ox) was equal to Fe2+ supplied by diffusion (Diff) (graph 3). The change in Fe2+ concentration at the biofilm surface is shown as a function of time (graph 4).
