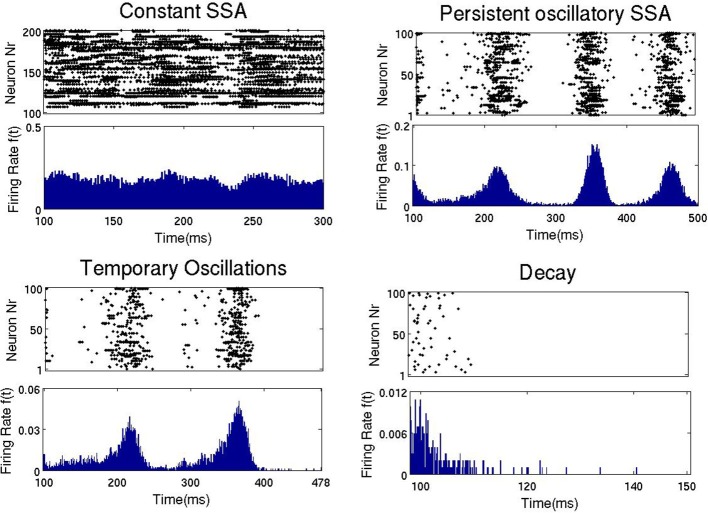
Figure 4.
Four types of network activity patterns. Each panel shows the raster plot of the spiking activity for a sample of 100 network neurons (Top), and the firing rate f(t) of all neurons (Bottom). Constant SSA: point A in Figure 3 (gex = 0.6, gin = 1). Persistent oscillatory SSA: point B in Figure 5 (gex = 0.12, gin = 0.6). Temporary oscillations: point C in Figure 5 (gex = 0.09, gin = 0.5). Decay: point D in Figure 5 (gex = 0.06, gin = 0.2).

