
FIG. 1.
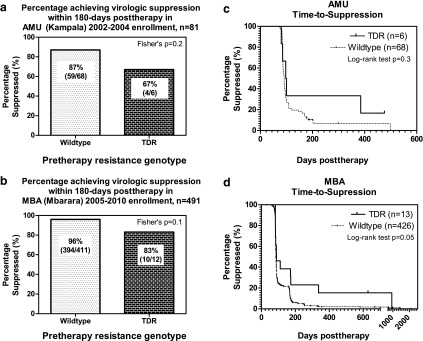
Virologic consequences of pretherapy resistance. (a) Percentage of AMU individuals who achieved virologic suppression (≤400 copies/ml) in the pretherapy wildtype versus the transmitted drug resistance (TDR) group. (b) Same as (a), MBA. (c) Kaplan–Meier plot showing time to virologic suppression in AMU individuals with pretherapy wildtype virus versus TDR. (d) Same as (c), MBA.