
Figure 4.
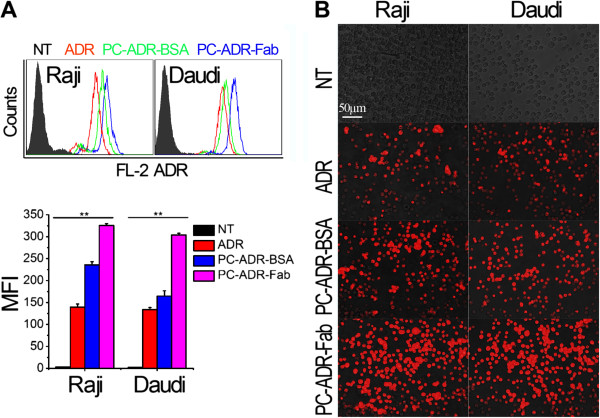
Cellular uptake and intracellular accumulation of ADR-loaded liposomes. (A) Detection of ADR fluorescence intensity by FCM. Up panel: the histogram represents the fluorescence intensity distribution of Raji and Daudi cells. Black histogram, no-treat; red histogram, free ADR treatment; green, PC-ADR-BSA treatment; blue, PC-ADR-Fab treatment. Down panel: Numerical data representing the mean fluorescence intensity (MFI) of ADR fluorescence in Raji and Daudi cells. Data are mean ± SD of at least three experiments. (B) The effects of liposomes on the intracellular uptake indicated by the inverse fluorescent microscopy. Red fluorescence represents the intracellular ADR. Scale bar 50 μm.