. 2014 Aug 14;3:e02893. doi: 10.7554/eLife.02893

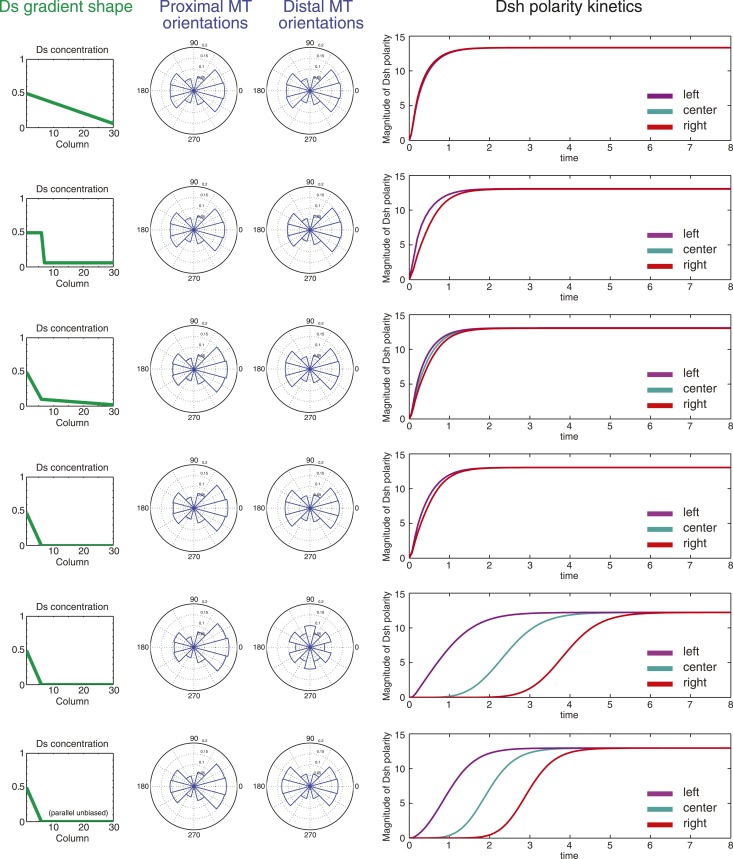
Figure 5. Simulations of polarization kinetics with different shapes of Ds gradients or imposed MT structures, using a mathematical model incorporating a simple representation of the Ft/Ds/Fj system to polarize MTs.

Input Ds gradients are shown on the left. Resulting (or imposed, on the right side of the last example) MT organization on the proximal or distal portion of the gradient are plotted (center). Kinetics of polarization of cells in column 8 (proximal = left), column 15 (center) or column 23 (distal = right; see Figure 5—figure supplement 1).

DOI: http://dx.doi.org/10.7554/eLife.02893.022

Figure 5.

Figure 5—figure supplement 1. Simulation results.

Figure 5—figure supplement 1.

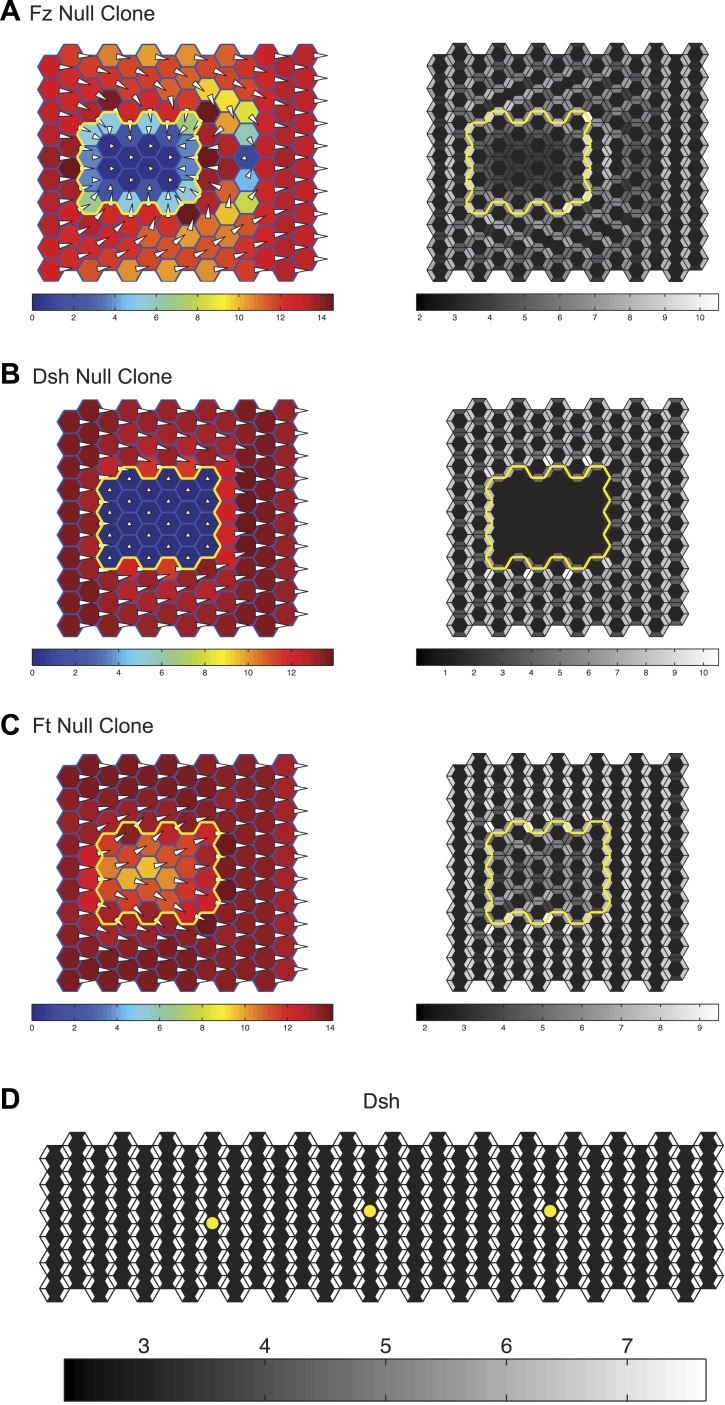
Simulations of clones of fz (A), dsh (B) and ft (C) null clones validating that the mathematical model captures the domineering non-autonomy phenotypes as well as the ability of the core system to propagate through ft mutant tissue. The color scale represents the magnitude of the vector sum of Dsh in each cell. The length of the hair and its distance from the center of the cell is also plotted proportionally to the vector sum of Dsh in each cell. (D) A 6 × 30 cell grid used to simulate polarization kinetics. Cells with kinetics plotted in Figure 5 are marked with asterisks. Greyscales represent the combined quantity of Dsh on either side of each shared cell boundary, as would be seen with light microscopy.