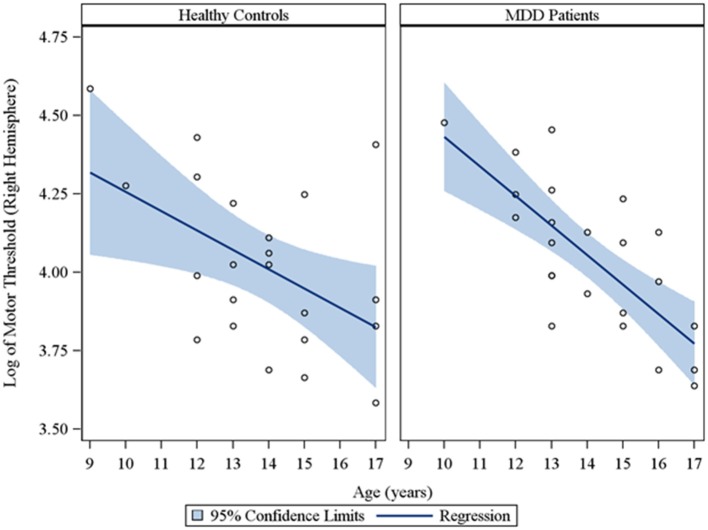
Figure 2.
Scatterplots of the log transformed MT values (right hemisphere) against age, with a fitted regression line and 95% confidence limits, by healthy controls and MDD patients. Note: The interaction of group with age indicated that the slope of the regression of motor threshold on age was similar for both healthy controls and MDD patients in the right hemisphere (p = 0.28).

