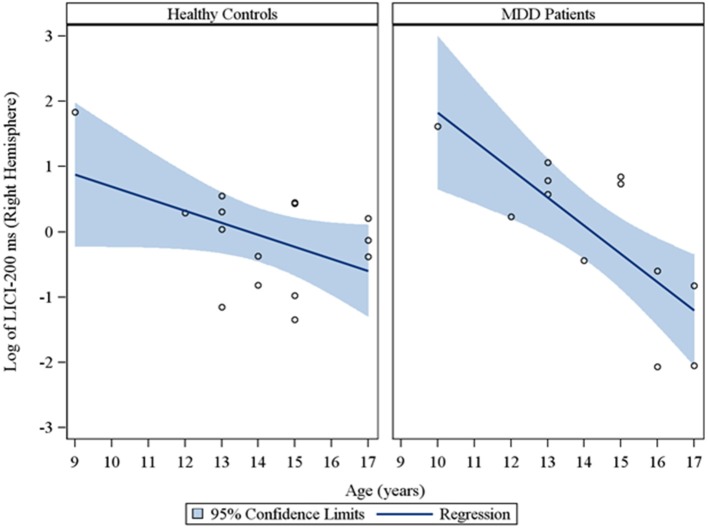
Figure 4.
Scatterplots of the log transformed LICI (200 ms interval) values (right hemisphere) against age, with a fitted regression line and 95% confidence limits, by healthy controls and MDD patients. Note: The interaction of group with age indicated that the slope of the regression of LICI-200 ms on age was significantly different for healthy controls vs. MDD patients in the right hemisphere (p = 0.049).

