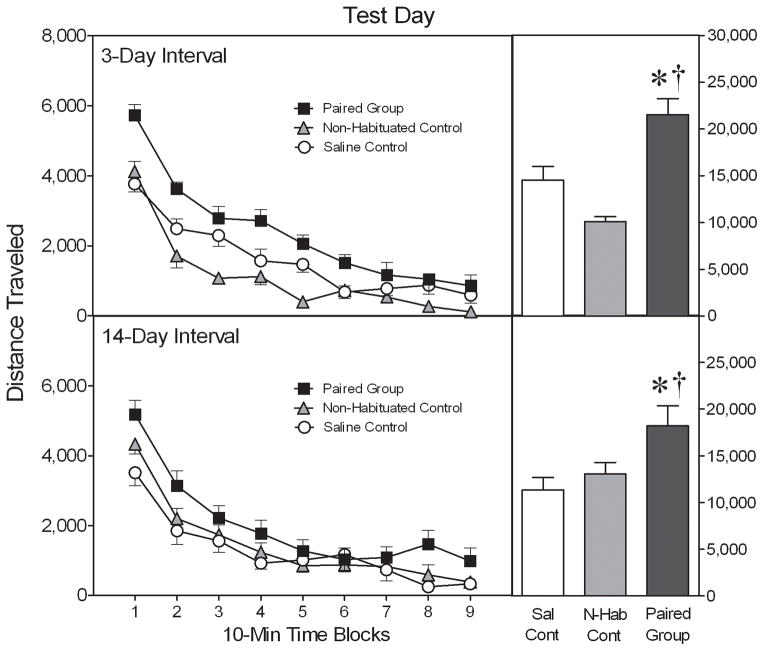
Fig. 6.
Mean (±SEM) distance traveled (cm) by adult rats (n = 10 per group) tested after a 3- or 14-day interval (i.e., on PD 82 or PD 93). The inset shows mean distance traveled collapsed across time blocks 1–9. * Significantly different from the Saline control group (P < 0.05). † Significantly different from the Non-Habituated control group (P < 0.05).

