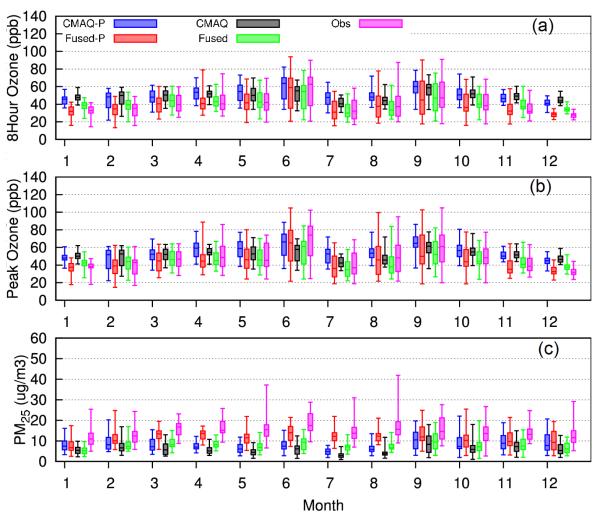
Figure 9.
Box-whisker plot of daily average 8-hr ozone, peak 1-hr ozone and 24-hr PM2.5 for HRR region R12 in the CSL study for year 2006. The ranges, quartiles, and medians are calculated based on the daily concentrations for each month. “Fused” stands for fused CMAQ results, “CMAQ” stands for raw CMAQ results, “-P” is used to denote population-weighted averaging, “Obs.” stands for simple averaging of all available observations within an HRR region.

