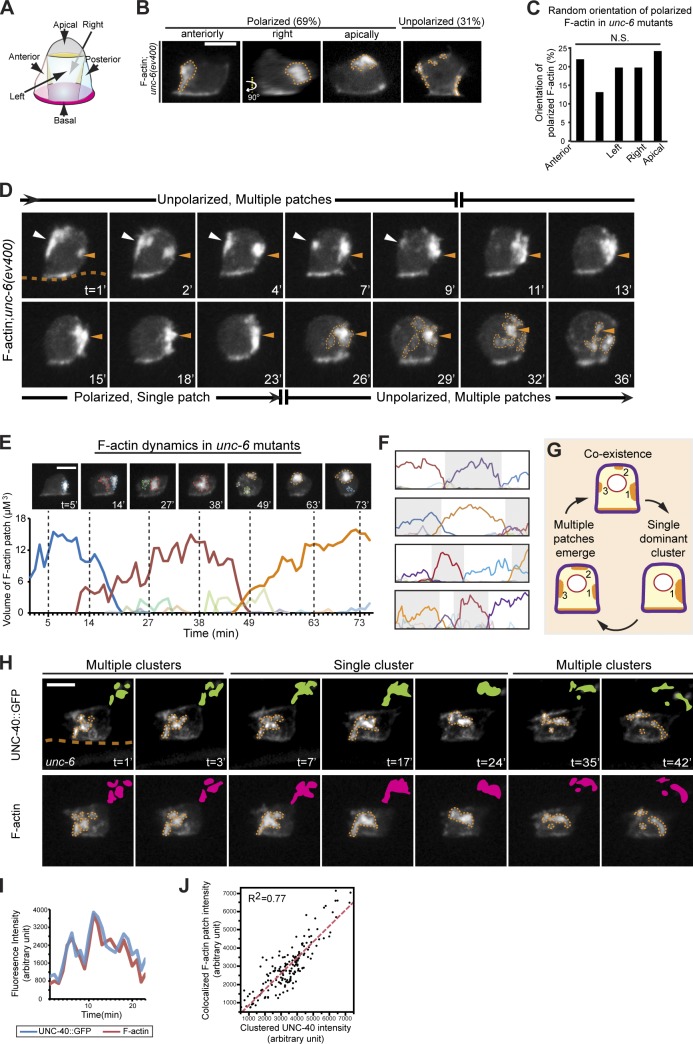
Figure 4.
UNC-40 undergoes periodic clustering and disassembly in the absence of UNC-6. Anterior is left; ventral is down. (A) A schematic diagram shows five membrane portions of the ACs used for scoring F-actin localization. (B and C) Most ACs in unc-6 mutants (69%) had a single dominant F-actin patch (orange broken lines, visualized with the F-actin probe cdh-3 > mCherry::moeABD) polarized randomly toward one of the five divided portions (P > 0.1, χ2 test, n = 65 animals observed). (D) Time series of F-actin localization in the AC of an unc-6 mutant revealed cycling between multiple F-actin patches and a single cluster. Initially, multiple small F-actin patches (white and orange arrowheads) formed randomly. After 9 min, one patch (orange arrowheads) grew and became dominant. By 26 min, this single cluster began disassembling, and multiple new F-actin foci (orange broken lines) formed. The orange broken line in the first frame indicates the position of the basement membrane where integrin maintains a light band of F-actin in the AC. (E) The volume of individual F-actin patches over time in an unc-6 mutant. Each colored line represents an individual patch. Images above show snapshots at times marked by the vertical broken lines (patches are outlined by colors that correspond to the graph). (F) Similar analysis of four other ACs in unc-6 mutants. (G) Schematic of cluster oscillations in unc-6 mutants. (H) A 42-min time series shows that clusters of UNC-40::GFP (top, green) colocalized with F-actin (bottom, magenta). (I) The fluorescence intensity of UNC-40::GFP and colocalized F-actin during the life cycle of a representative F-actin patch in an unc-6 mutant animal. (J) UNC-40::GFP intensity at each time point (black dots) was plotted against colocalized F-actin patch intensity, revealing a tight correlation (measured using coefficient of determination R2) during cluster oscillations. Data were pooled from nine cluster life cycles in seven animals. Bars, 5 µm.

