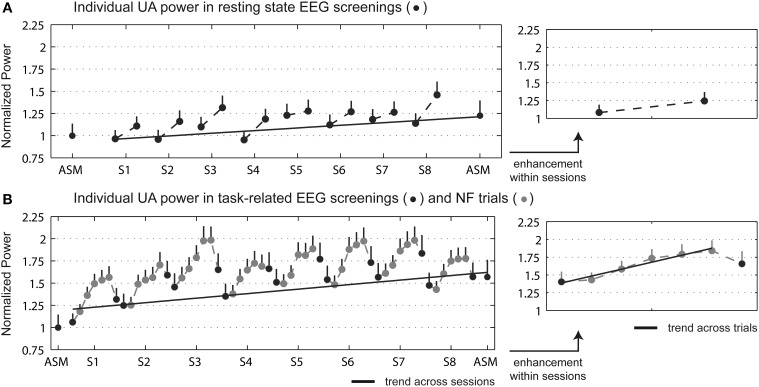
Figure 2.
Individual UA power (mean + s.e.m.) averaged across the feedback electrodes (P3, Pz, P4, O1, O2) for the NF group in the initial and final EEG screenings, and during the NF sessions. (A) Displays the resting state EEG screenings, and (B) the task-related EEG screenings and NF trials. Data was normalized to the power in the initial screening. Right figures display the power enhancement within sessions, in which in the EEG data of the NF sessions was averaged across sessions. Dark and light gray dots depict EEG screenings and NF trials, respectively, and gray line the relevant trend measurements.

