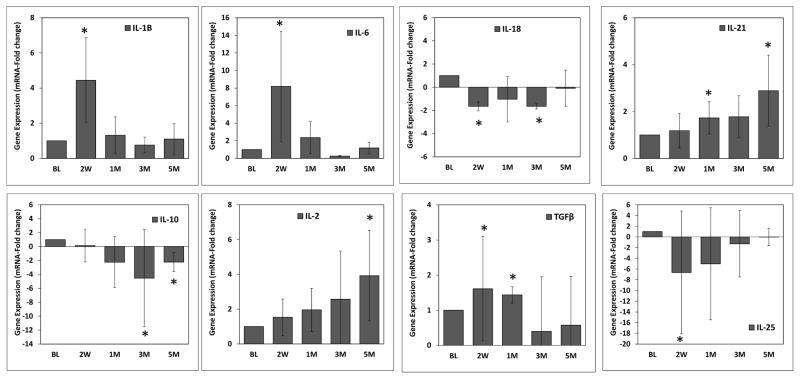
Figure 2.
Cytokine expression levels determined by qRT-PCR. Significant changes in cytokine expression by microarray were validated using qRT-PCR. Total mRNA samples (n=18) from each time point were pooled and cytokine gene expression analyzed using triplicates. Data are expressed as means ± standard deviations. *p≤0.05 when baseline values where compared to the different time points, as determined by Student’s t test.

